1. Home > 
  2. Stock Photos > 
  3. Schematic Digital Interface with Numeric Panels and Data Bars

Schematic Digital Interface with Numeric Panels and Data Bars Image

Schematic Digital Interface with Numeric Panels and Data Bars

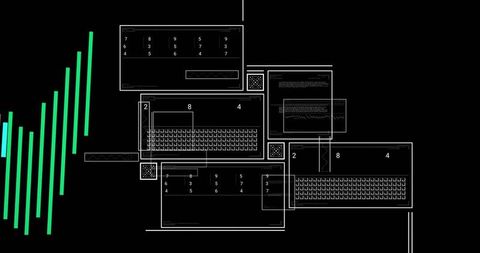
This abstract digital design features schematic representations of keyboards and numeric grid panels on a black interface, highlighted by teal data bars. It captures futuristic technological concepts perfect for illustrating software development, data analytics, digital interfaces, or cyber themes. Suitable for technology presentations, abstract illustrations, or content about digital innovation.

Powered by Shutterstock logo - Get 15% off with code: PIKWIZARD15
Rotating 3D globe outlining neon continents in data space, orbiting spheres and binary code panels. Futuristic, technology, data, visualization, digital, cyber, abstract - Powered by Shutterstock - Get 15% off with code: PIKWIZARD15Digital Global Connectivity Network, A high-tech visualization of global connectivity featuring a glowing digital Earth composed of dotted patterns and interconnected nodes.  - Powered by Shutterstock - Get 15% off with code: PIKWIZARD15KPI data analytics concept, Key performance indicator analysis system. Information technology digital software management. Visualization tech solution. Business artificial intelligence. AI dashboard. - Powered by Shutterstock - Get 15% off with code: PIKWIZARD15Showing dashboard plotting line and bar charts on blue grid, with world map and numeric overlays. Analytics, visualization, data, technology, finance, dashboards, growth - Powered by Shutterstock - Get 15% off with code: PIKWIZARD15Data flow from database and cloud to processing and analytics dashboards, representing data analysis, automation, insight generation, and digital intelligence Vouch - Powered by Shutterstock - Get 15% off with code: PIKWIZARD15

Credit Photo

If you would like to credit the Photo, here are some ways you can do so

Free (free of charge)

Free for personal and commercial use.

Author: Creative Art

Similar Free Stock Images

Financial Data Processing Over Digital Interface and Graphs
Premium
Digital Compliance Quality concept with a businessman holding glowing virtual chart in his palm, showing rising financial data, analytics icons, and investment growth for corporate success.
Financial Chart Analysis and Data Visualization Concept
Abstract Data Visualization with Bar and Line Graphs on Network Grid
Premium
Data-driven decision-making empowers business through analytics, datum collection, and AI systems. Data driven tools support cloud data processing and data visualization across datum platforms. Spline
Futuristic Analytics Dashboard Interface with Dynamic Data Visuals
Financial Data Processing with Digital Interface Graphics
Woman Engaging with Secure Computer Data
Abstract Graphic Business Data Visualization
Premium
Conceptual visual of data analysis with black woman working in the office
Abstract Cityscape with Blue and Pink Data Graphs Overlay
Colorful Bar Graph with Data Overlay on Black Background
Digital Analytics Dashboard with Code and Graphs Visualization
Cityscape Enhances Financial Data Visualization Digital Concept
Futuristic Data Visualization Dashboard with Neon Green Line Chart
Digital Financial Data Analysis on Global Map
Colorful Financial Data Visualization on Digital Grid
Digital Bar Graph with Blue Data Visualization
Premium
A detailed close-up of a complex digital circuit board, glowing with bright nodes and lines, suggesting intricate technological processes or data flow.
Digital Data Graph Overlays on Urban Cityscape
Financial Data Analysis with Graphs and Charts on Dark Background
Colorful Bar and Line Charts Analyzing Financial Data Over Dark Background
Caucasian Woman Reviewing Graphs on Mobile Device, Business Technology Concept
Futuristic Data Visualization with Vertical Bar Charts
Binary Code Flowchart Background with Digital Animation
Digital Financial Chart with Candlesticks and Line Graphs for Market Analysis
Futuristic Trading Dashboard with Neon Graphs and Data Visualization
Futuristic Technology Analytics Interface on Dark Background
Binary Code with Colorful Bar Graph for Data Analysis
Futuristic Data Visualization with Neon Line Graphs and Digital Interface
Pink Graph and Data Analysis on 3D Grid for Financial Trends
Premium
Data flow from database and cloud to processing and analytics dashboards, representing data analysis, automation, insight generation, and digital intelligence Latch
Candlestick Chart with Financial Data on Grid Background
Digital Stock Market Data with Upward Trend Graph
Dynamic Analytics Dashboard with Line and Bar Chart Visualization
3D Holographic Chart on Futuristic Virtual Display
Financial Data Chart Over City Silhouette
3D Blue Bar Graph on Black Background Visualizing Data Trends
Dynamic Financial Market Chart Display with Candlesticks
Premium
Doctor using AI technology with digital data analytics, medical icons, and futuristic interface, representing healthcare innovation, telemedicine, big data in medicine, and smart health solutions.
Futuristic Cyber Security Technology with Digital Data Display
Dynamic Financial Data Analytics Display with Graphs
Dynamic Data Graph with Futuristic Technology Background
Futuristic Data Processing Interface with Graphs
Global Financial Data Processing Illustration on Yellow
Financial Data Analysis with Charts and Graphs
Dynamic Data Visualization with Bar Charts and Line Graphs in Digital Interface
Digital Data Analysis Against Abstract Cityscape
Premium
Businessman using AI technology on software ready to use robot to create or analyze data and big data technology. Business analysis and visualization of complex data sets on computer on computer
Premium
High-tech data visualization dashboard for analytics and performance tracking, including data visualization, trend, data report, and data chart. Vouch
Digital Financial Statistics and Analytics Visualization with Graphs
Digital Financial Data Visualization with Bar Graphs and Line Charts
Vibrant Financial Data Analysis on Black Background
Digital Data Visualization with 3D Bar Graph
Premium
Visual representation of GDPR with a digital shield and lock, symbolizing data protection and privacy compliance.
Premium
Floating wireframe globe depicting Earth in cyber-network, with inner globe and network nodes. Digital, futuristic, technology, connectivity, network, abstract, innovation
Black Bar Graph and Line Chart on White Background
Data Security with Tech Bar Graph Overlay
Social Media Interaction Graph on Digital Network
Digital Stock Market Chart and Networking Interface
Premium
Data flow from database and cloud to processing and analytics dashboards, representing data analysis, automation, insight generation, and digital intelligence Latch
Digital Profile Security in Data Visualization Interface
Digital Interface with Data Processing and Graphs
Global Data Processing with Abstract Graph and Network
Futuristic Interface with Digital Data and Global Network Visualization
Premium
A close-up view of a hand interacting with a digital tablet displaying various data visualizations, ideal for exploring business analytics and technology.
Financial Candlestick Chart on Digital Grid Background
Digital Financial Graphs and Data Analysis Visualization
Futuristic Digital Interface with Data Visualization and C++ Code
Premium
Global AI and data processing system enhances data, AI, and processing efficiency through digital network and global integration of intelligent technology Vouch
Financial Data Analysis with Bar and Line Graph Elements
Digital Projection of Financial Data with Bar Graphs
Financial Data Analysis with Digital Graph Overlay on Dark Grid
High-Tech Financial Data Analysis Display with Graphs
Premium
Professional designing database schema and data structure on digital interface, showing data connection, system architecture, and information management for innovative business technology solutions.
High-Tech Digital Interface with Interactive Data Elements
Digital Data Processing with Binary Codes on Black Background
Financial Data Visualization with Declining Trend Line
Digital Financial Graphs on Dark Background Highlighting Global Economy Trends
Global Business Analytics and Growth Concept Hologram
Digital Dashboard Interface with Floating GUI Panels
Futuristic 3D Data Visualization with Bar and Line Graphs
Futuristic Data Processing Digital Interface on Black Background
3D Graph Bar Growing with City Skyline Background
Premium
AI transforms how we manage digital data. From smart indexing to AI-driven search, file handling becomes intelligent. AI file management improves speed, accuracy, and data organization. Muxer
Digital Grid with Data Processing and Global Connections Visualization
Digital Interface Graph Data Analytics Tech Overlay
Colorful Graphical Data Analysis in Abstract Background
Abstract Financial Data Visualization with Analytics
Premium
Medical professional interacting with holographic interface for patient monitoring and AI-assisted health data visualization in smart healthcare system
Premium
Projecting holographic globe with network nodes in data center corridor, with server racks and LEDs. Technology, network, futuristic, digital, visualization, infrastructure, innovation
Financial Data Analytics with Abstract Graphs and Currency Symbols
Dynamic Financial Data Chart on Dark Digital Dashboard
Digital Data Chart Visualization in Modern Office Environment
Graph Showing Stock Market Activity and Financial Data Analysis
Financial Data Analysis with Code Interface on Black Background
Modern Data Visualization with Bar and Line Charts on Futuristic Interface
Premium
AI Using. Silhouetted analysts interact with a large AI data. AI Display charts graphs and analytics. Business team using futuristic AI interface visuals data. Technology with biz insight and big data
Colorful Financial Graph with Digital Technology Concept
Business Analytics Concept with Data Graphs and Office Desk
Digital Display of Financial Data Analytics and Graphs
Digital Stock Market Analysis with Graphs and Charts
Premium
Big Data Analytics Neural Network Data Flow Visualization, AI Machine Learning, Quantum Computing, Binary Code Digital Grid, Futuristic Artificial Intelligence Technology Abstract Background
Futuristic Interface with Coding Panels and Binary Flow
Futuristic Data Analysis with Bar Graphs and Charts Overlay
Real-Time Financial Market Trends Visualization with Candlestick and Histogram
Premium
Close-up of hands working with AI-powered business dashboard showing project timelines, progress bars, charts, and analytics for data-driven management.
Premium
Bold artwork. Group of doctors analyzing holographic brain projection with collaborative emotion. Concept of teamwork, neuroscience, healthcare branding, education, and digital innovation in medicine.
Premium
A digital world map overlay showing global financial data, market trends, and international trade connections above a modern city skyline, representing global business and economic networks.
Glowing Neon Court with Digital Data Visualization Bars
Financial Data Processing with Global Currency Indicators
Digital Data Analysis with Rising Arrows on Black Background
Statistical Analysis in Server Room Highlighting Technology Data
Premium
Displaying blue circular overlay with cloud lock icon in data center corridor with server racks. Cybersecurity, cloud, data, network, server, technology, digital
Abstract Computer Interface and Data Visualization Graphic
Interactive 3D Graph with Digital Numeric Overlay
Financial Data Processing Visualization on Dark Background
Dynamic Data Display with Bars and Lines on Grid Background
Premium
Data center engineer running diagnostic scripts using VR headset, examining equipment. Server room worker using virtual reality to evaluate rackmounts performance metrics, maintaining system stability
Futuristic Data Processing Interface on Blue Background
Digital Financial Data Analysis on Dark Background
Dynamic Data Visualization Depicting Financial Growth Trends
Digital Financial Data and Market Trends Analysis on Black Background
Premium
Combining translucent bar charts and zigzag graph over grassy plain with transmission towers, grid. Energy, infrastructure, data visualization, sustainability, technology, analytics, rural
Abstract Financial Data Charts and Graphs on Black Background
Explore More Free Stock Images