- Home >
- Free Stock Photos & Images >
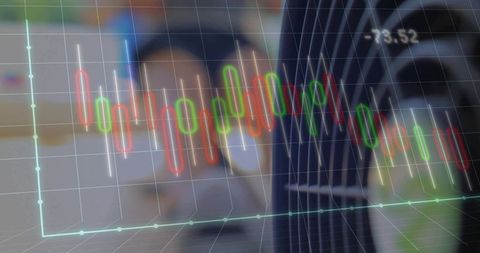
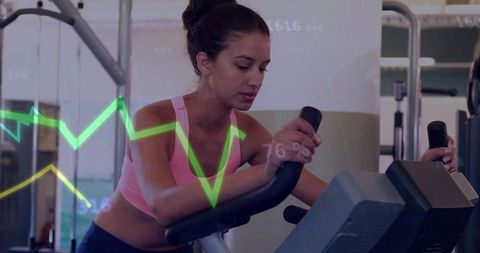
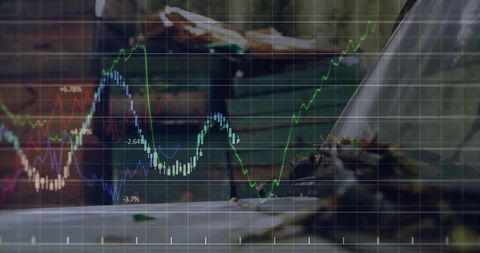
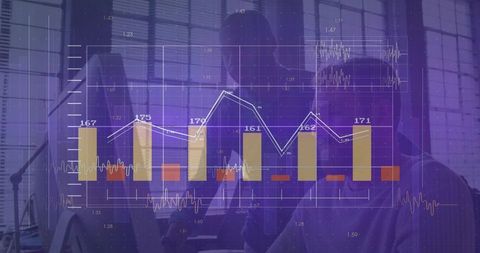
- Scientist analyzing lab data with candlestick chart overlay, microscope and analytics
Scientist analyzing lab data with candlestick chart overlay, microscope and analytics Free Stock Image
Depicting scientist in lab coat wearing blue gloves and adjusting microscope while candlestick chart overlay spans foreground, suggesting crossover between scientific research and financial analysis. Combining laboratory equipment and stock market visualization for illustrating data-driven decision making, biotech investment, healthcare analytics, research funding, financial modeling of clinical trials. Working well for articles, presentations, websites, reports, blogs focusing on biotech finance, data science, medtech startups, investor pitches. Serving as background for financial reports, hero banners, editorial about research funding, slides for investor meetings, and marketing materials for scientific startups. Offering soft lab tones with vivid chart highlights for easy text or logo overlay and clean cropping for multiple aspect ratios.

downloads
Credit Photo
If you would like to credit the Photo, here are some ways you can do so
Free (free of charge)
Free for personal and commercial use.
Author: Authentic Images