
- Home >
- Stock Photos >
- Scientist Analyzing Laboratory Data with Charts and Graphs
Scientist Analyzing Laboratory Data with Charts and Graphs Image
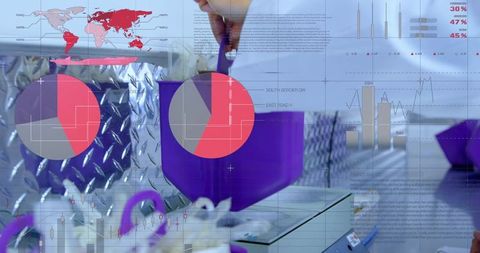
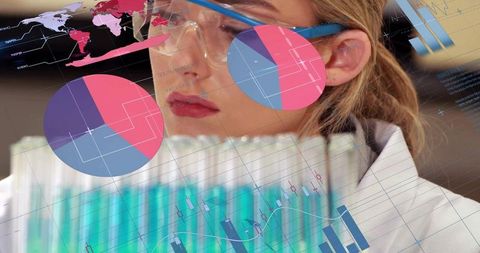
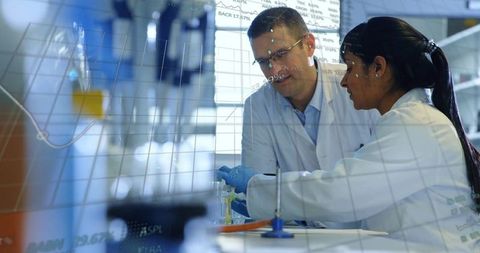
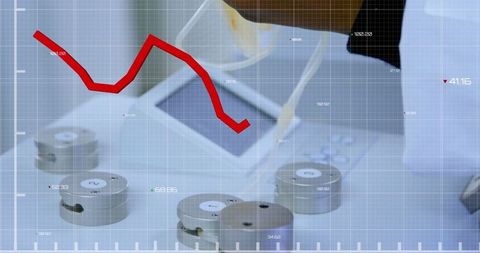
Scientist actively engaged in data analysis using charts and graphs in a lab environment. Ideal for materials focused on scientific research, technological advancement, or innovation in data analytics. Perfect for illustrating modern technology in laboratory processes and scientific discoveries.
Powered by 


downloads
Tags:
More
Credit Photo
If you would like to credit the Photo, here are some ways you can do so
Text Link
photo Link
<span class="text-link">
<span>
<a target="_blank" href=https://pikwizard.com/photo/scientist-analyzing-laboratory-data-with-charts-and-graphs/4aa3c94b45976813adcdc8a9203a5bfa/>PikWizard</a>
</span>
</span>
<span class="image-link">
<span
style="margin: 0 0 20px 0; display: inline-block; vertical-align: middle; width: 100%;"
>
<a
target="_blank"
href="https://pikwizard.com/photo/scientist-analyzing-laboratory-data-with-charts-and-graphs/4aa3c94b45976813adcdc8a9203a5bfa/"
style="text-decoration: none; font-size: 10px; margin: 0;"
>
<img src="https://pikwizard.com/pw/medium/4aa3c94b45976813adcdc8a9203a5bfa.jpg" style="margin: 0; width: 100%;" alt="" />
<p style="font-size: 12px; margin: 0;">PikWizard</p>
</a>
</span>
</span>
Free (free of charge)
Free for personal and commercial use.
Author: Authentic Images
Similar Free Stock Images

Premium


Premium


Premium


Premium


Premium

Premium


Premium


Premium


Premium


Premium


Premium

Premium

Premium


Premium


Premium


Premium


Premium


Premium

Premium


Premium


Premium


Premium


Premium


Premium


Premium

Explore More Free Stock Images