
- Home >
- Stock Photos >
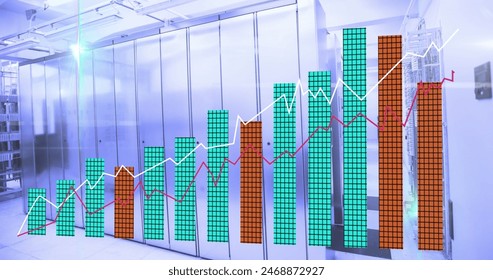
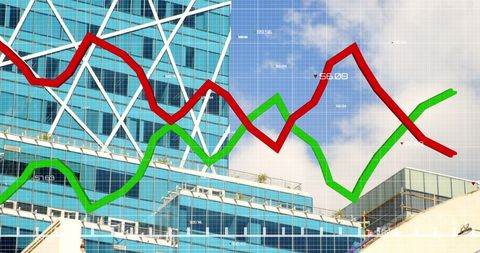
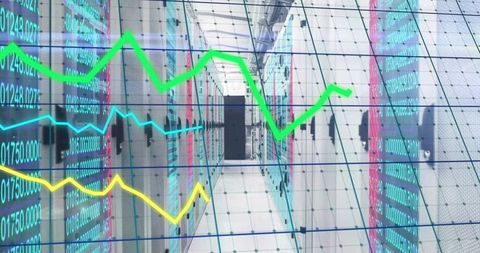
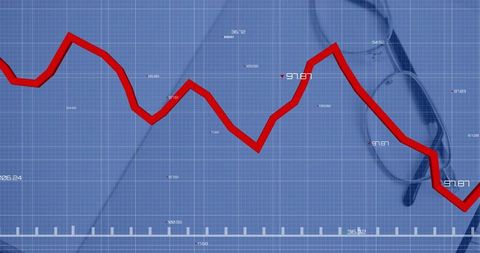
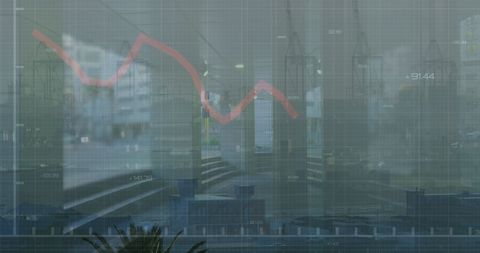
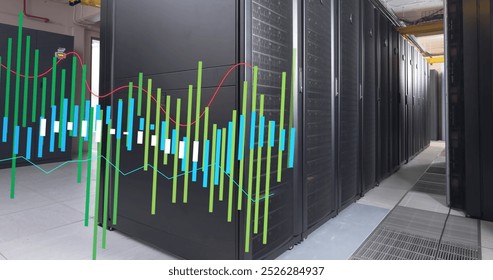
- Server Room Data Analytics with Declining Graph Representation
Server Room Data Analytics with Declining Graph Representation Image

Visualizing server performance data with a downward trend, highlights IT infrastructure and network challenges. Suitable for showcasing business intelligence reports or technology management scenarios.
Powered by  - Get 15% off with code: PIKWIZARD15


downloads
Tags:
More
Credit Photo
If you would like to credit the Photo, here are some ways you can do so
Text Link
photo Link
<span class="text-link">
<span>
<a target="_blank" href=https://pikwizard.com/photo/server-room-data-analytics-with-declining-graph-representation/c88fe05e12256f71e20be03cbd1f9d9c/>PikWizard</a>
</span>
</span>
<span class="image-link">
<span
style="margin: 0 0 20px 0; display: inline-block; vertical-align: middle; width: 100%;"
>
<a
target="_blank"
href="https://pikwizard.com/photo/server-room-data-analytics-with-declining-graph-representation/c88fe05e12256f71e20be03cbd1f9d9c/"
style="text-decoration: none; font-size: 10px; margin: 0;"
>
<img src="https://pikwizard.com/pw/medium/c88fe05e12256f71e20be03cbd1f9d9c.jpg" style="margin: 0; width: 100%;" alt="" />
<p style="font-size: 12px; margin: 0;">PikWizard</p>
</a>
</span>
</span>
Free (free of charge)
Free for personal and commercial use.
Author: Awesome Content
Similar Free Stock Images

Premium


Premium

Premium


Premium


Premium


Premium


Premium

Premium


Premium


Premium


Premium


Premium


Premium


Premium


Premium


Premium


Premium


Premium


Premium

Premium


Premium


Premium


Premium


Premium


Premium

Explore More Free Stock Images