- Home >
- Stock Photos >
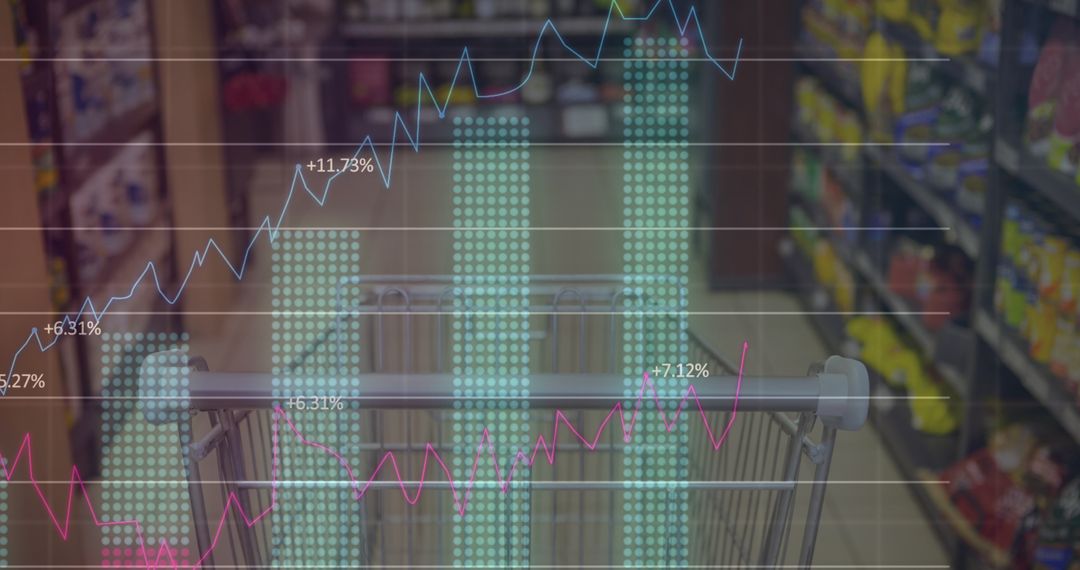
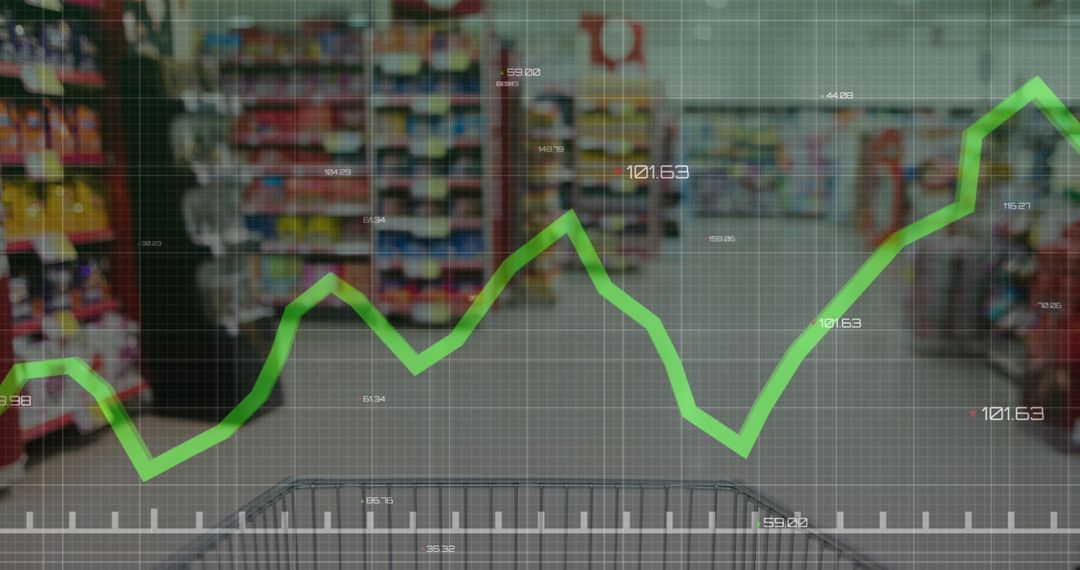
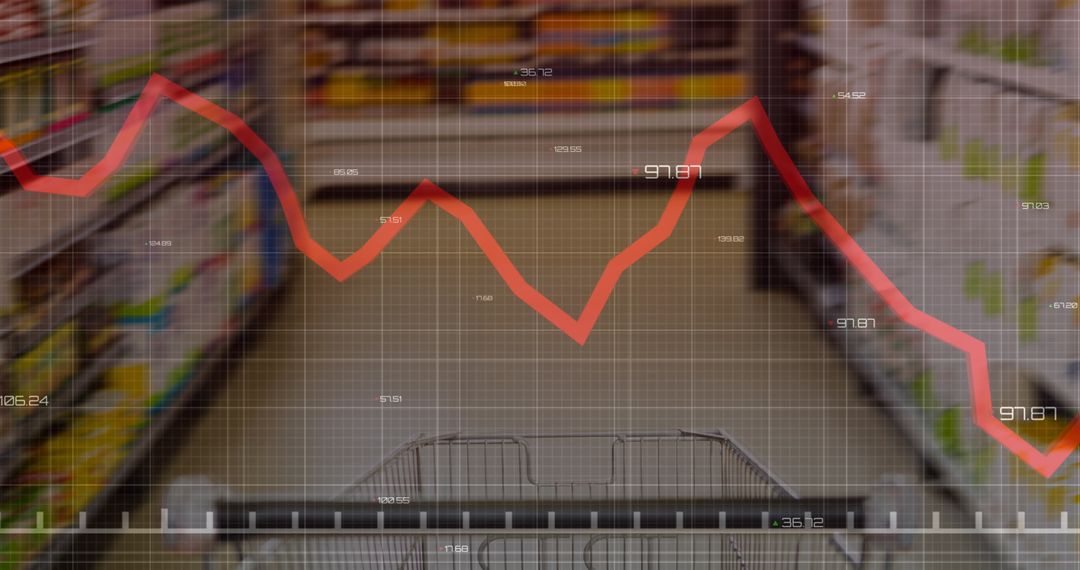
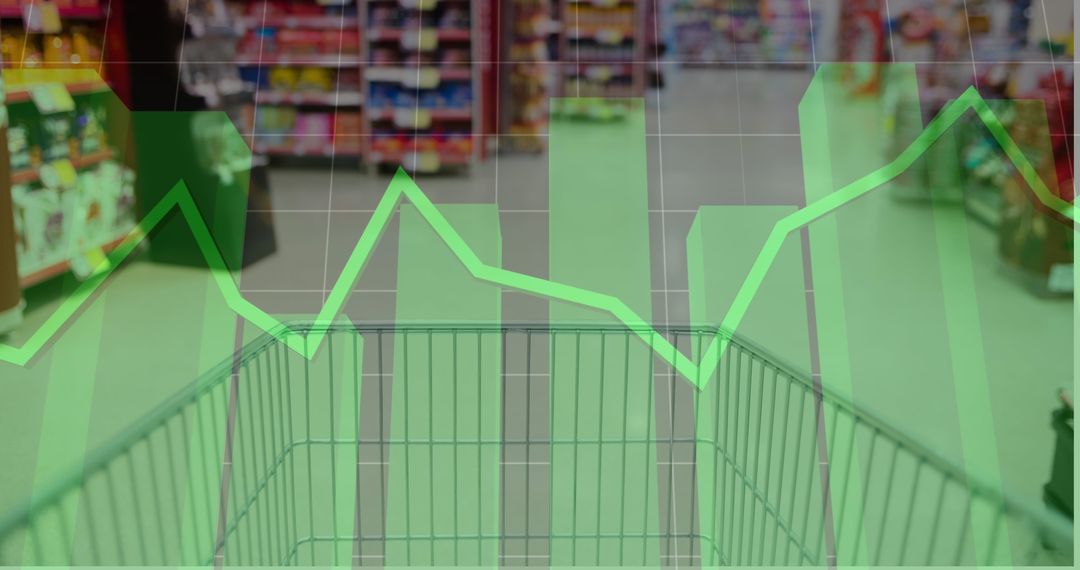
- Shopping Carts with Overlaid Financial Data Illustrating Inflation
Shopping Carts with Overlaid Financial Data Illustrating Inflation Image

Visual image highlights shopping carts set against a backdrop of translucent financial data. Overlay represents economic indicators, emphasizing consumer price changes due to inflation and market trends. Ideal for illustrating economic reports, inflation studies, and financial analytics.
Powered by 


2
downloads
downloads
Tags:
More
Credit Photo
If you would like to credit the Photo, here are some ways you can do so
Text Link
photo Link
<span class="text-link">
<span>
<a target="_blank" href=https://pikwizard.com/photo/shopping-carts-with-overlaid-financial-data-illustrating-inflation/3f648fa2c23119894597ac0e94e8a1bb/>PikWizard</a>
</span>
</span>
<span class="image-link">
<span
style="margin: 0 0 20px 0; display: inline-block; vertical-align: middle; width: 100%;"
>
<a
target="_blank"
href="https://pikwizard.com/photo/shopping-carts-with-overlaid-financial-data-illustrating-inflation/3f648fa2c23119894597ac0e94e8a1bb/"
style="text-decoration: none; font-size: 10px; margin: 0;"
>
<img src="https://pikwizard.com/pw/medium/3f648fa2c23119894597ac0e94e8a1bb.jpg" style="margin: 0; width: 100%;" alt="" />
<p style="font-size: 12px; margin: 0;">PikWizard</p>
</a>
</span>
</span>
Free (free of charge)
Free for personal and commercial use.
Author: Awesome Content
Similar Free Stock Images

Premium


Premium


Premium


Premium


Premium


Premium


Premium


Premium


Premium


Premium


Premium


Premium


Premium


Premium


Premium


Premium


Premium


Premium


Premium


Premium


Premium


Premium


Premium


Premium