
- Home >
- Stock Photos >
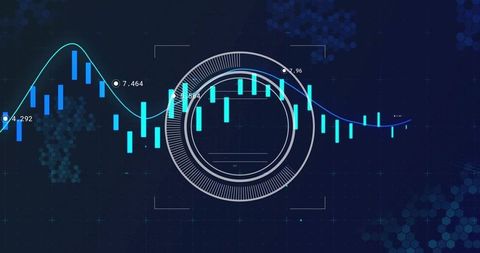
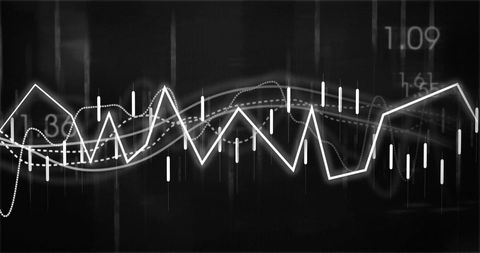
- Showing Neon Candlestick Market Chart with Flowing Trend Line and Glowing Hexagon Grid
Showing Neon Candlestick Market Chart with Flowing Trend Line and Glowing Hexagon Grid Image
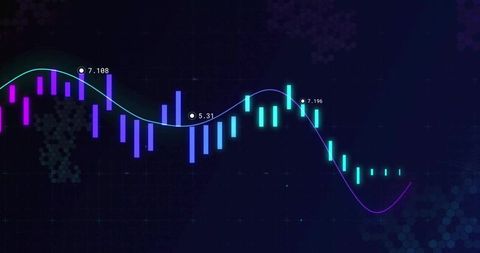
Showing neon candlestick bars in purple-blue-cyan palette with flowing trend line and labeled markers over dark hexagon grid. Creating sleek futuristic visual for market analysis, trading dashboards, fintech branding, and cryptocurrency presentations. Serving hero banners, landing pages, app headers, pitch decks, investor reports, blog illustrations, social media ads, and explainer videos. Functioning as background for data-driven presentations, overlaying charts in video, or powering headers for cryptocurrency and stock market articles. Color palette allowing easy recoloring and overlaying text or logo. High contrast and glowing accents enhancing readability on web and mobile interfaces.
Powered by 


0
downloads
downloads
Tags:
More
Credit Photo
If you would like to credit the Photo, here are some ways you can do so
Text Link
photo Link
<span class="text-link">
<span>
<a target="_blank" href=https://pikwizard.com/photo/showing-neon-candlestick-market-chart-with-flowing-trend-line-and-glowing-hexagon-grid/cea2161996a9312160bcfc8052612f03/>PikWizard</a>
</span>
</span>
<span class="image-link">
<span
style="margin: 0 0 20px 0; display: inline-block; vertical-align: middle; width: 100%;"
>
<a
target="_blank"
href="https://pikwizard.com/photo/showing-neon-candlestick-market-chart-with-flowing-trend-line-and-glowing-hexagon-grid/cea2161996a9312160bcfc8052612f03/"
style="text-decoration: none; font-size: 10px; margin: 0;"
>
<img src="https://pikwizard.com/pw/medium/cea2161996a9312160bcfc8052612f03.jpg" style="margin: 0; width: 100%;" alt="" />
<p style="font-size: 12px; margin: 0;">PikWizard</p>
</a>
</span>
</span>
Free (free of charge)
Free for personal and commercial use.
Author: Creative Art
Similar Free Stock Images

Premium


Premium


Premium


Premium


Premium


Premium

Premium


Premium


Premium


Premium


Premium


Premium


Premium


Premium


Premium


Premium


Premium


Premium


Premium


Premium


Premium


Premium


Premium


Premium


Premium

