- Home >
- Stock Photos >
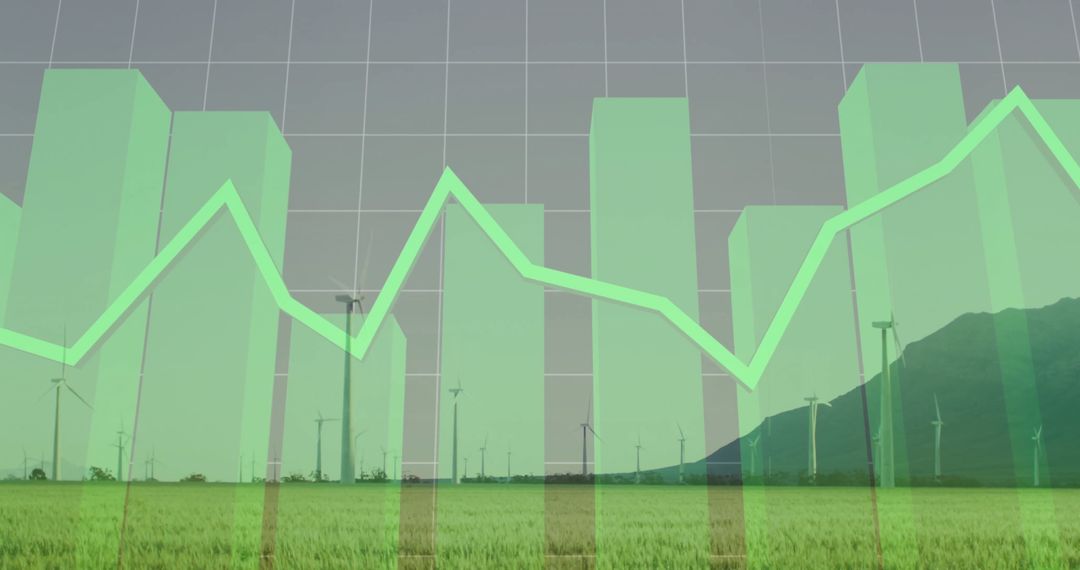
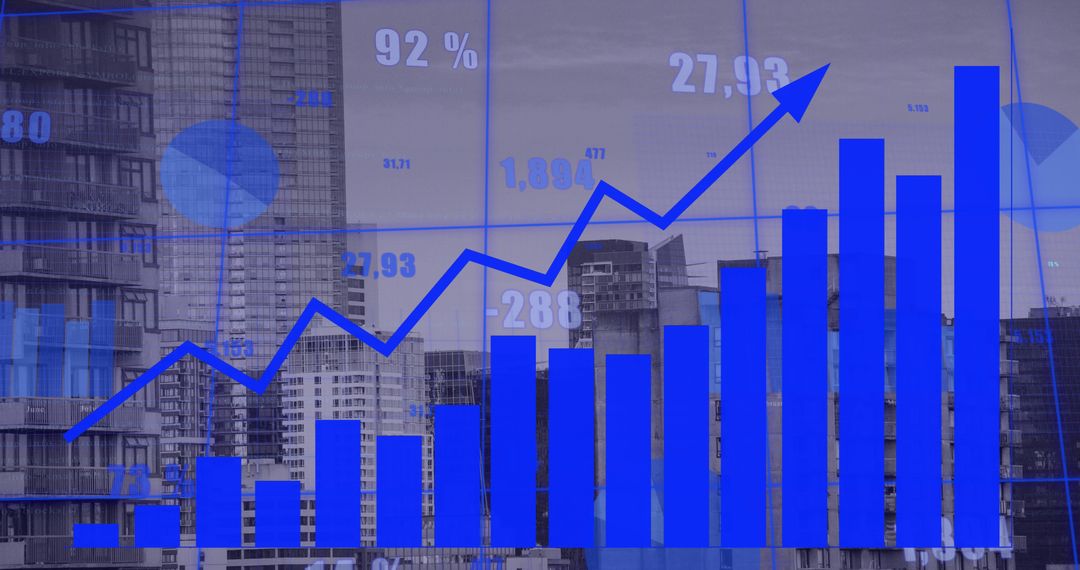
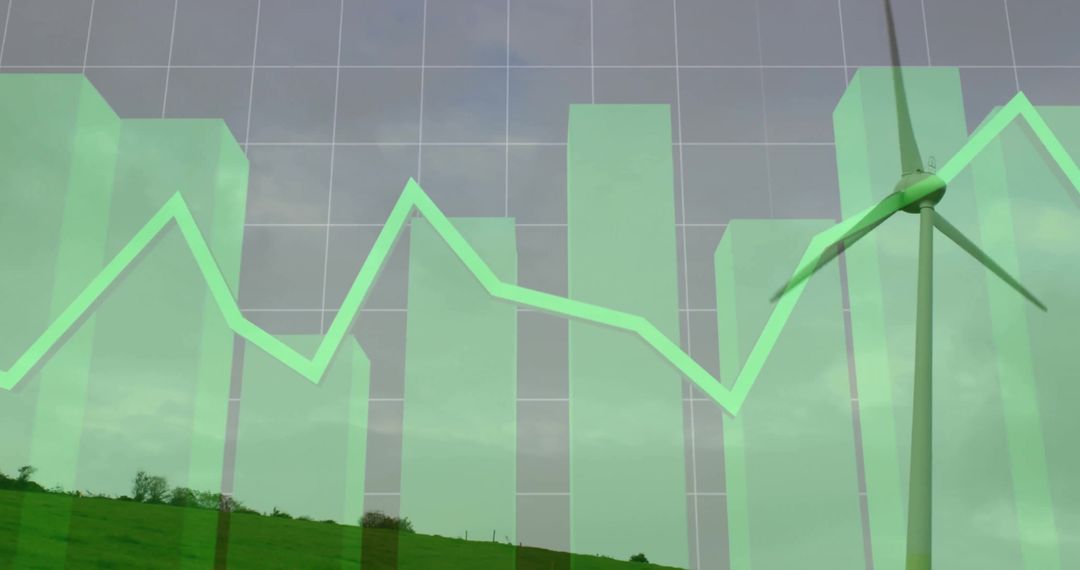
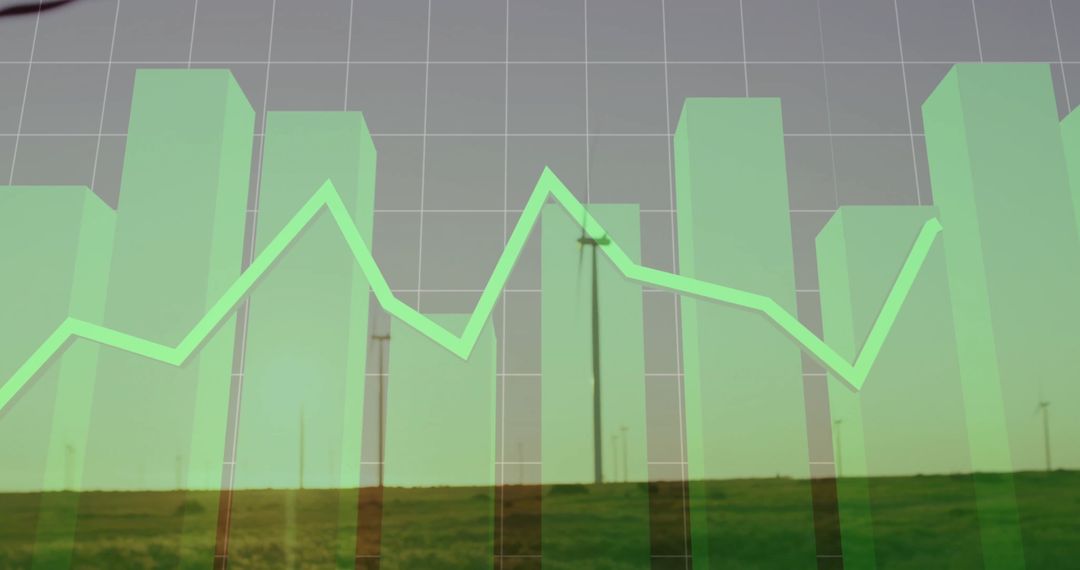
- Skyward Financial Graph Overlay Showcasing Data Trends
Skyward Financial Graph Overlay Showcasing Data Trends Image

Translucent bars with an overlay of a line graph against a sky grid background effectively depict data analytics and visualization. This abstract, visually appealing representation is ideal for use in presentations, financial reports, and tech or analytics-related articles, helping convey insights and trends in a compelling manner.
Powered by  - Get 15% off with code: PIKWIZARD15


0
downloads
downloads
Tags:
More
Credit Photo
If you would like to credit the Photo, here are some ways you can do so
Text Link
photo Link
<span class="text-link">
<span>
<a target="_blank" href=https://pikwizard.com/photo/skyward-financial-graph-overlay-showcasing-data-trends/b62a6ec1defa731bc9a654aadb6afec8/>PikWizard</a>
</span>
</span>
<span class="image-link">
<span
style="margin: 0 0 20px 0; display: inline-block; vertical-align: middle; width: 100%;"
>
<a
target="_blank"
href="https://pikwizard.com/photo/skyward-financial-graph-overlay-showcasing-data-trends/b62a6ec1defa731bc9a654aadb6afec8/"
style="text-decoration: none; font-size: 10px; margin: 0;"
>
<img src="https://pikwizard.com/pw/medium/b62a6ec1defa731bc9a654aadb6afec8.jpg" style="margin: 0; width: 100%;" alt="" />
<p style="font-size: 12px; margin: 0;">PikWizard</p>
</a>
</span>
</span>
Free (free of charge)
Free for personal and commercial use.
Author: Creative Art
Similar Free Stock Images

Premium


Premium


Premium


Premium


Premium


Premium


Premium


Premium


Premium


Premium


Premium


Premium


Premium


Premium


Premium


Premium


Premium


Premium


Premium


Premium


Premium


Premium


Premium


Premium