- Home >
- Stock Photos >
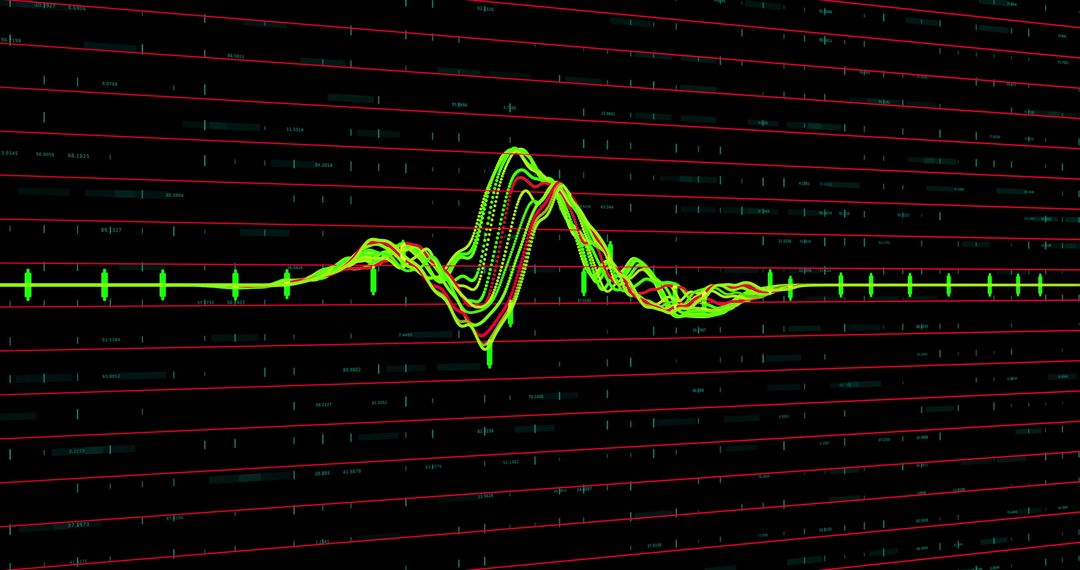
- Slumpflation Concept with Digital Data and Charts
Slumpflation Concept with Digital Data and Charts Image

Text slumpflation prominently displayed over digitized data grids and graphs, illustrating macroeconomic challenges. Image useful for articles or presentations focusing on economic concepts, analysis associated with inflation and recession, and financial studies relating to market trends. Ideal for educational materials or content creators in economic fields.
Powered by 


2
downloads
downloads
Tags:
More
Credit Photo
If you would like to credit the Photo, here are some ways you can do so
Text Link
photo Link
<span class="text-link">
<span>
<a target="_blank" href=https://pikwizard.com/photo/slumpflation-concept-with-digital-data-and-charts/5cda66eca1a1d869390cd90aa8471d8a/>PikWizard</a>
</span>
</span>
<span class="image-link">
<span
style="margin: 0 0 20px 0; display: inline-block; vertical-align: middle; width: 100%;"
>
<a
target="_blank"
href="https://pikwizard.com/photo/slumpflation-concept-with-digital-data-and-charts/5cda66eca1a1d869390cd90aa8471d8a/"
style="text-decoration: none; font-size: 10px; margin: 0;"
>
<img src="https://pikwizard.com/pw/medium/5cda66eca1a1d869390cd90aa8471d8a.jpg" style="margin: 0; width: 100%;" alt="" />
<p style="font-size: 12px; margin: 0;">PikWizard</p>
</a>
</span>
</span>
Free (free of charge)
Free for personal and commercial use.
Author: Awesome Content
Similar Free Stock Images