- Home >
- Stock Photos >
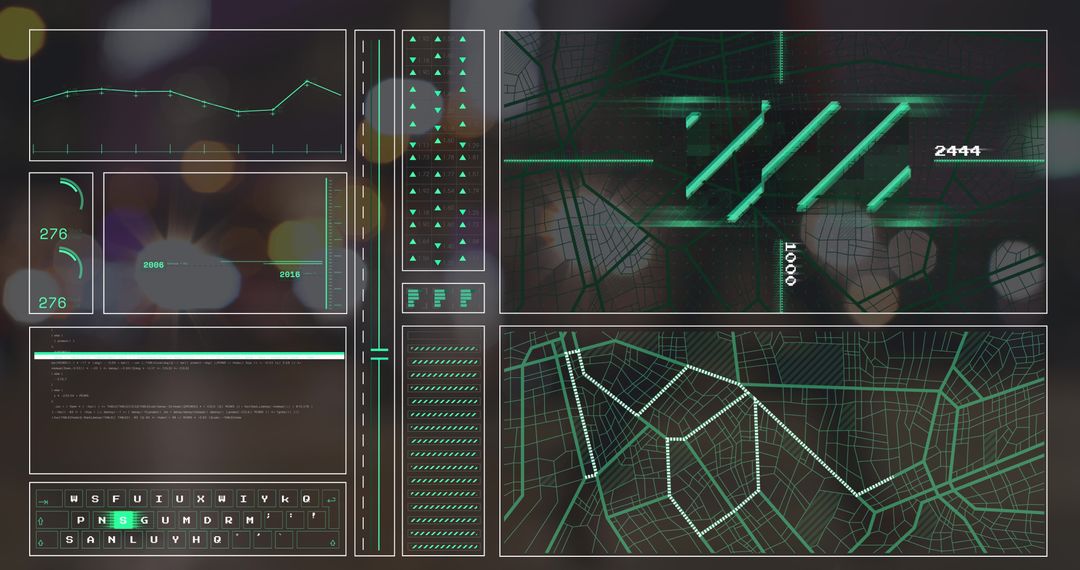
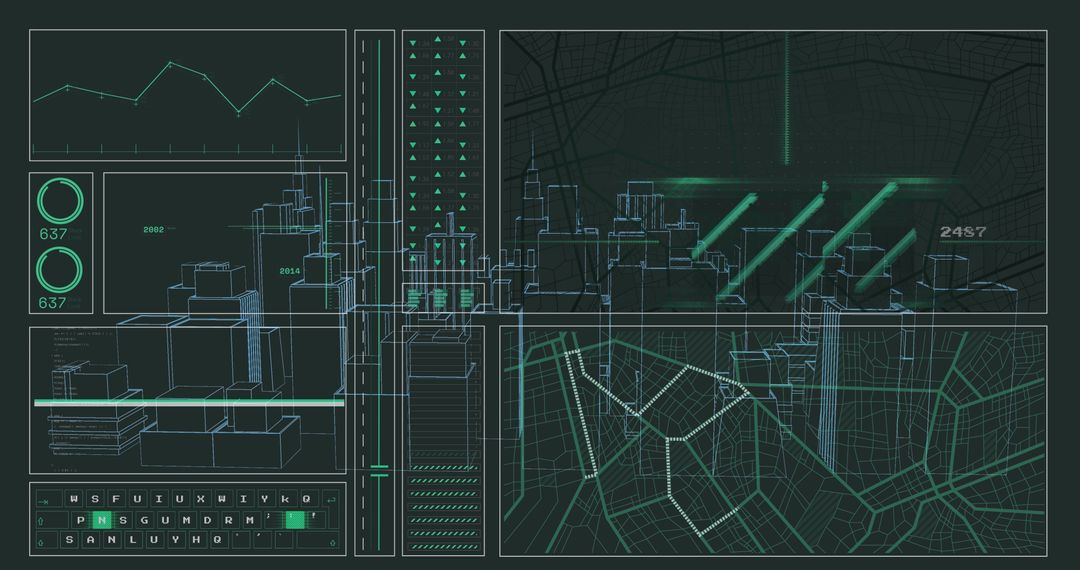
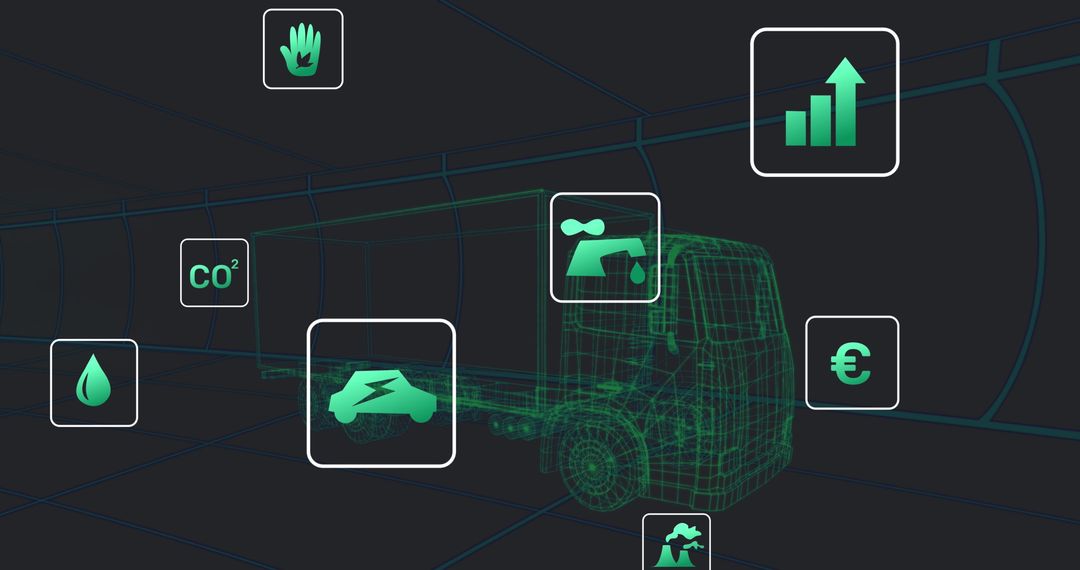
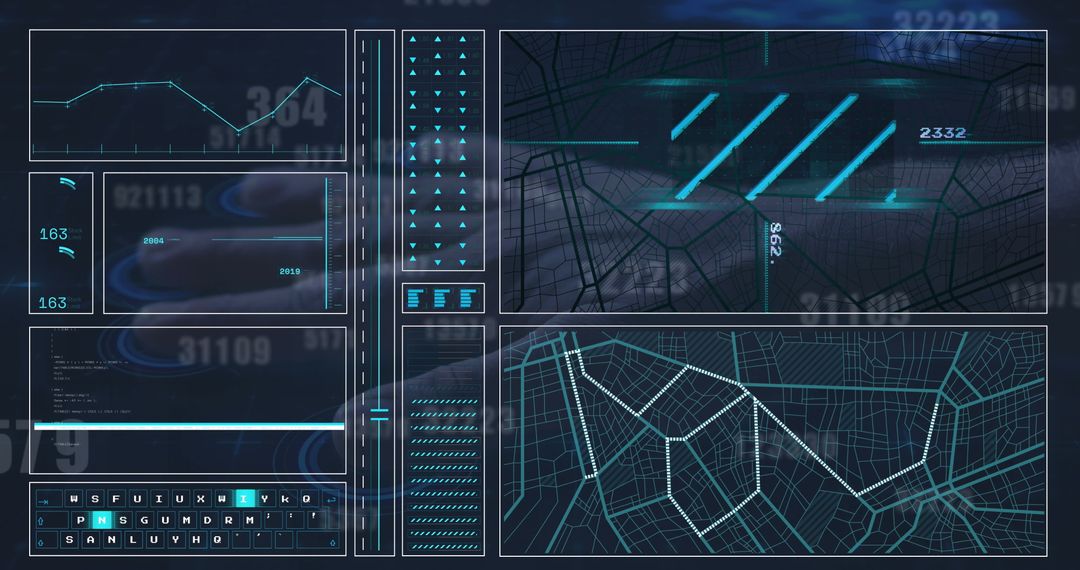
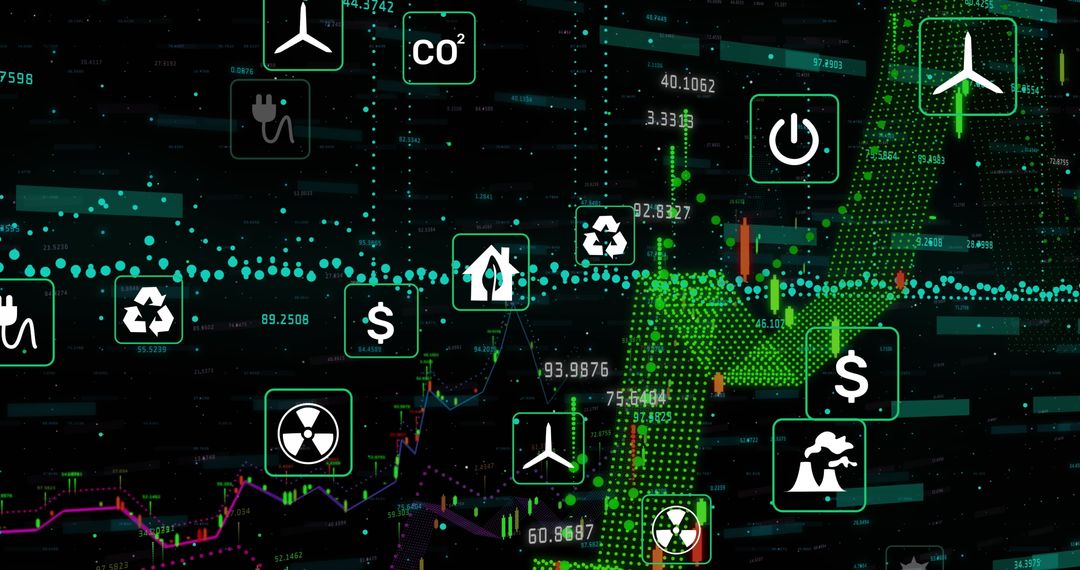
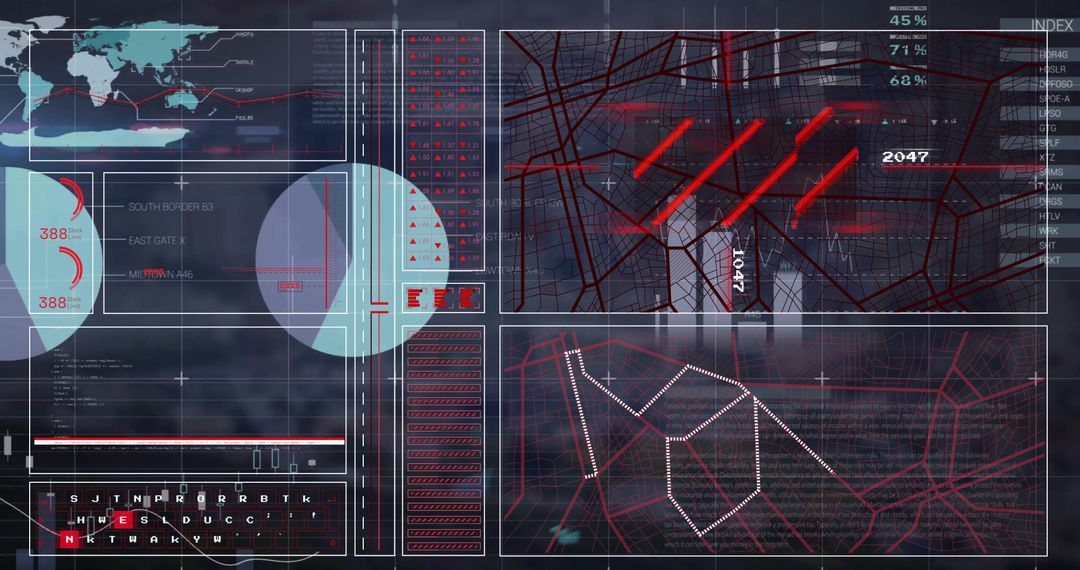
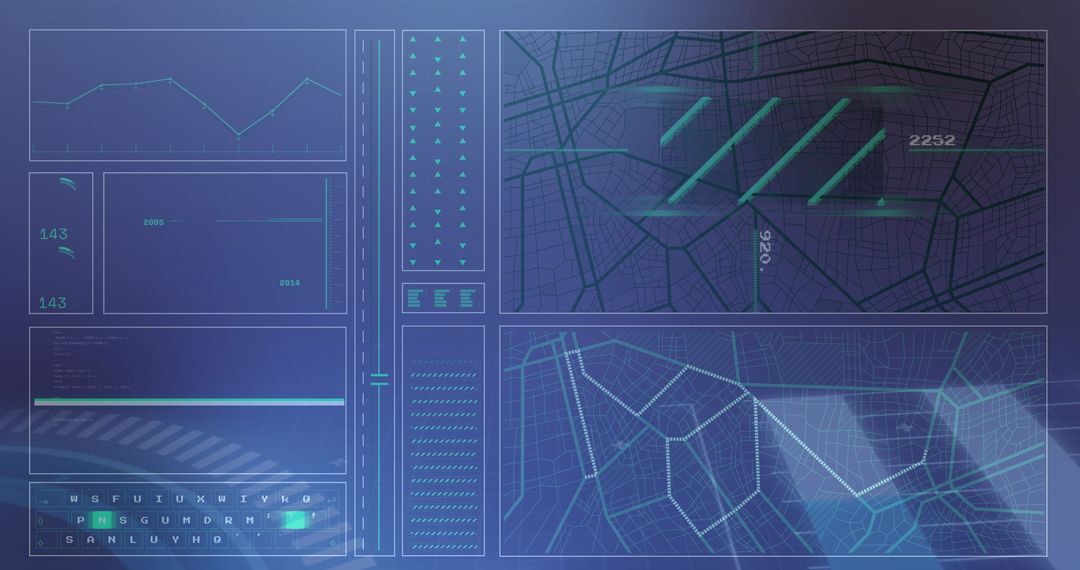
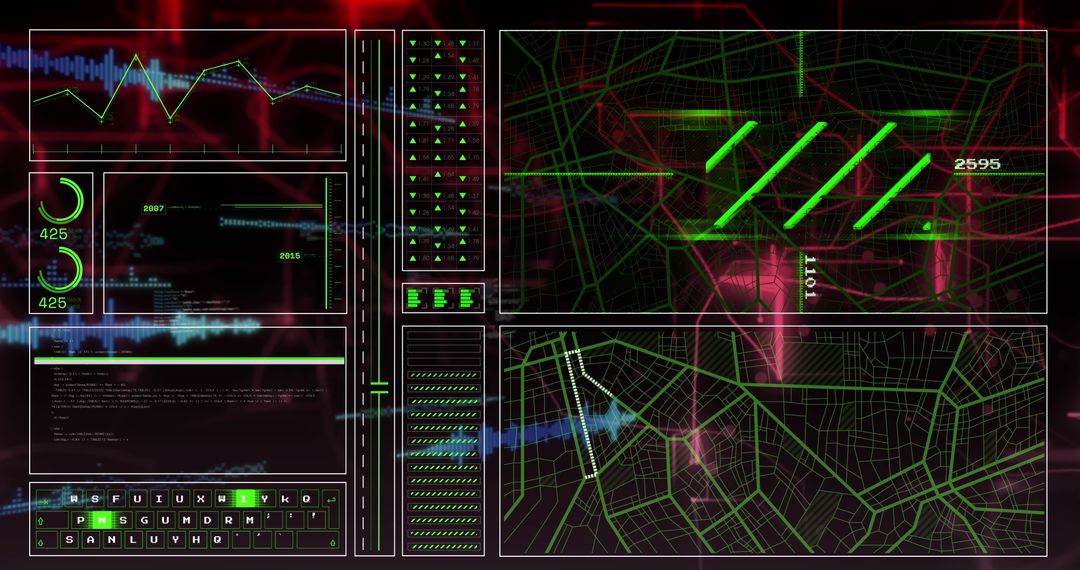
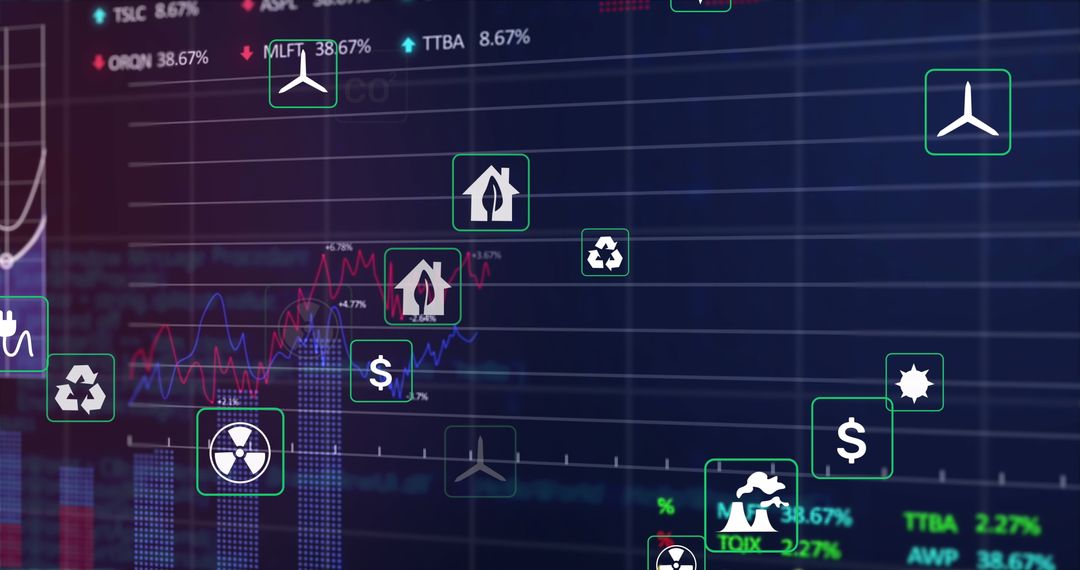
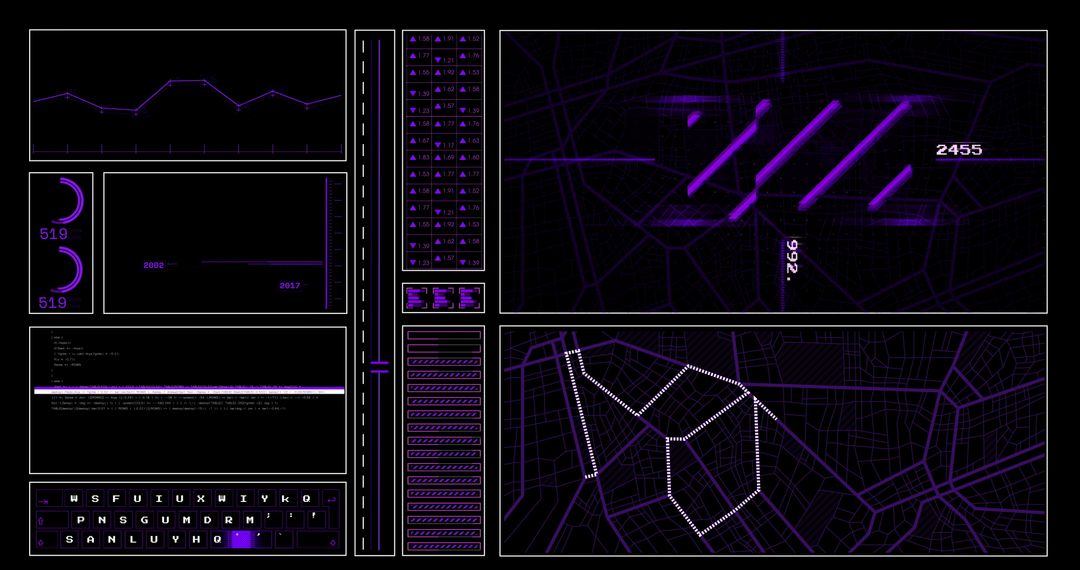
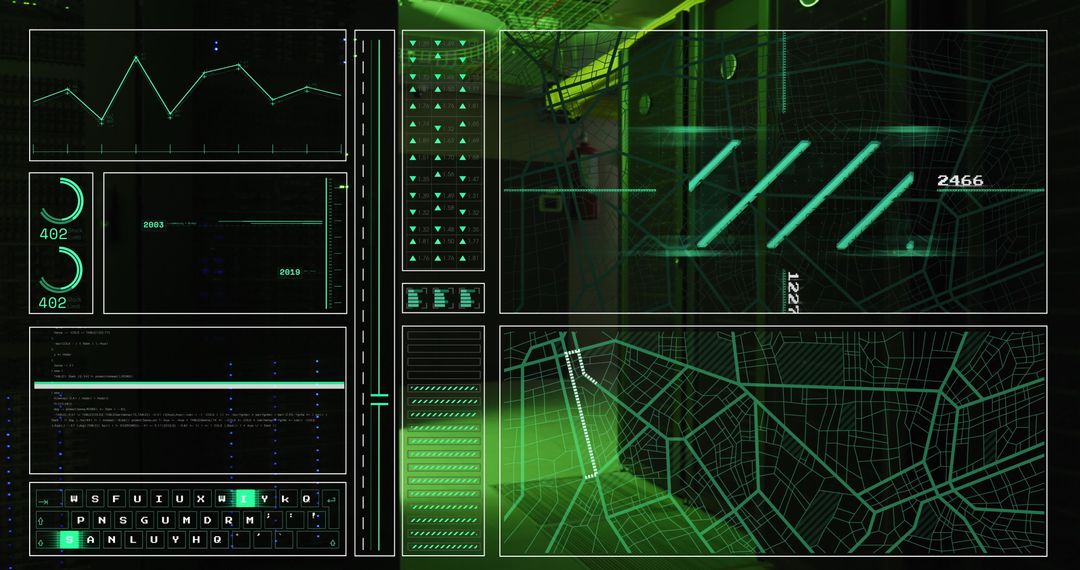
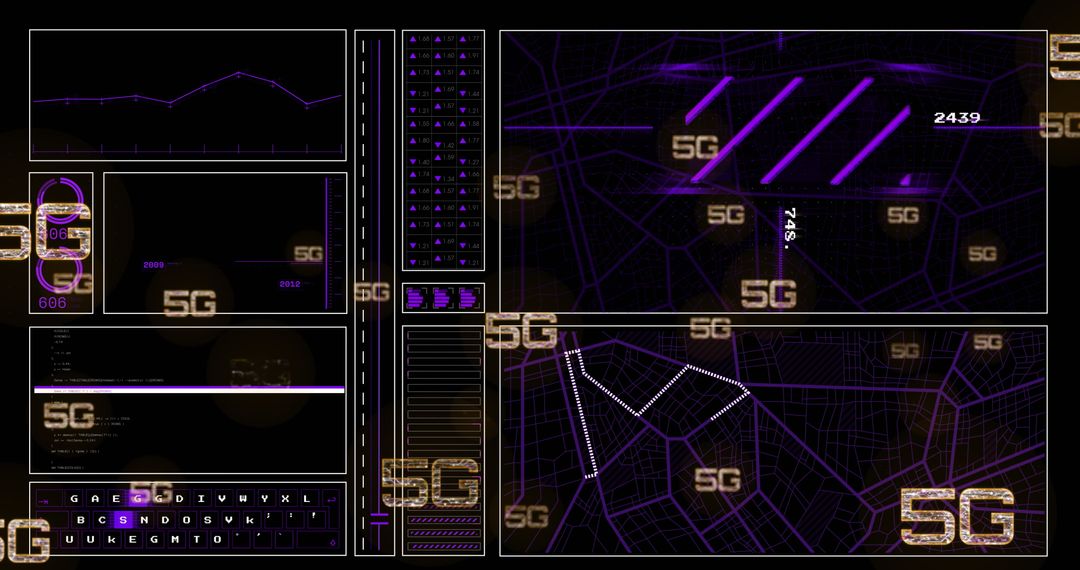
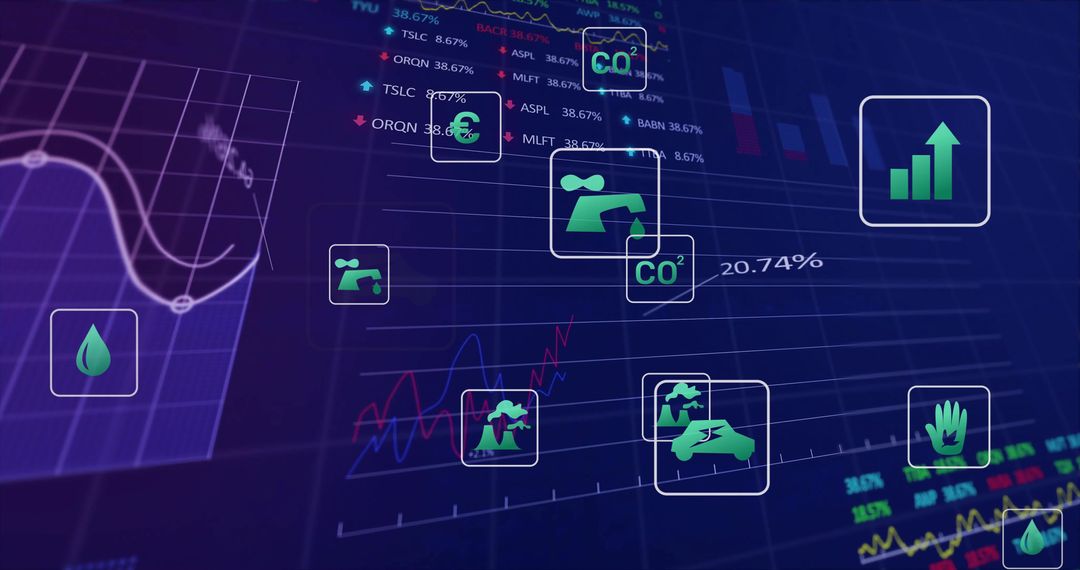
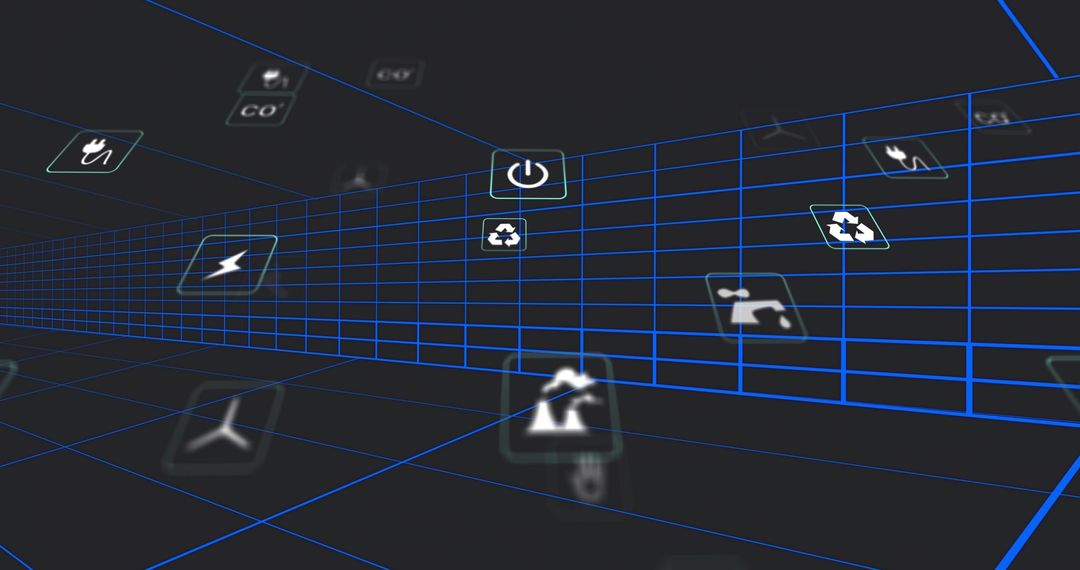
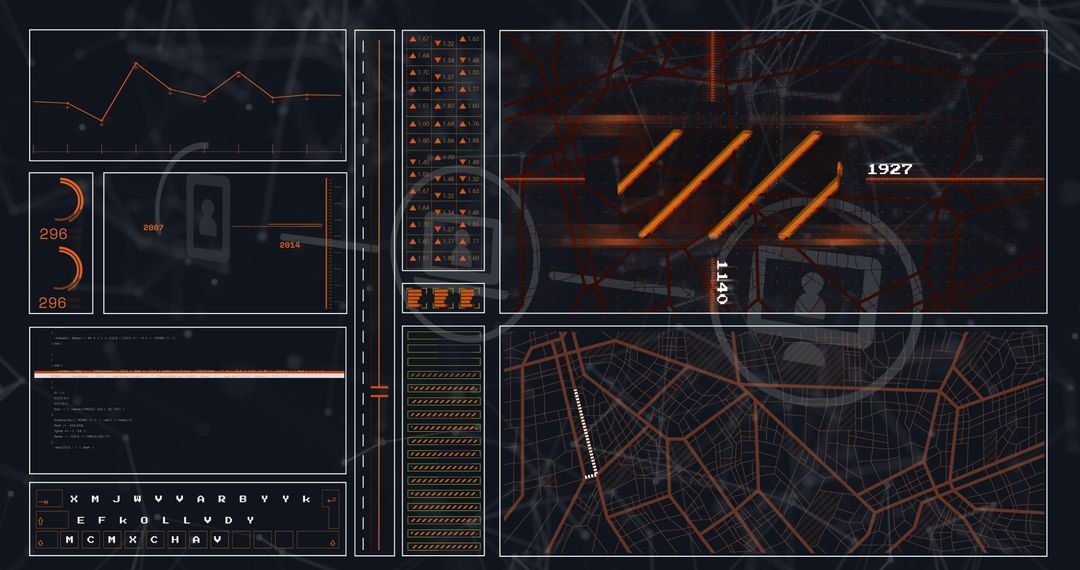
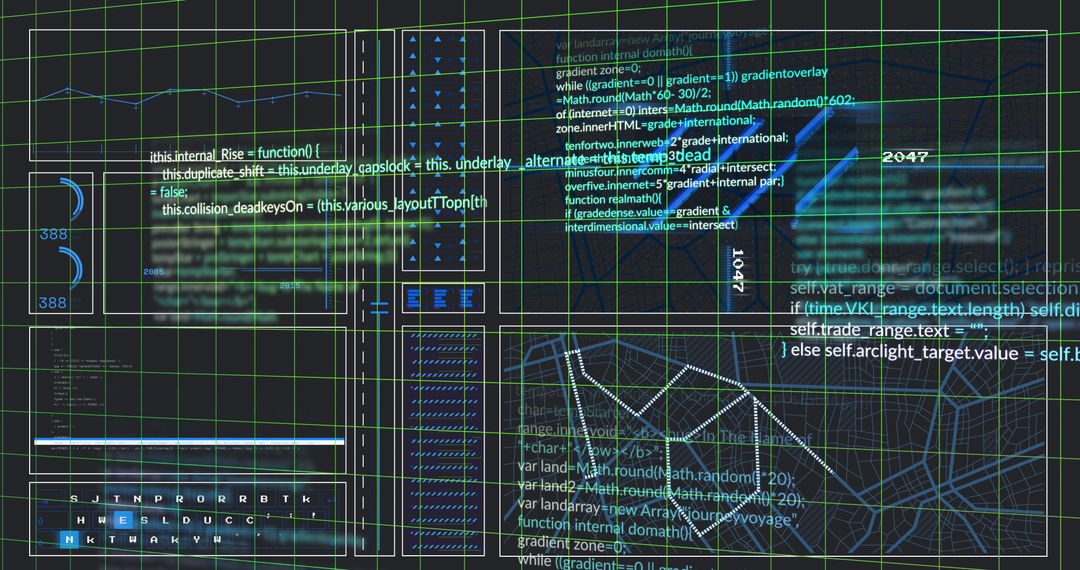
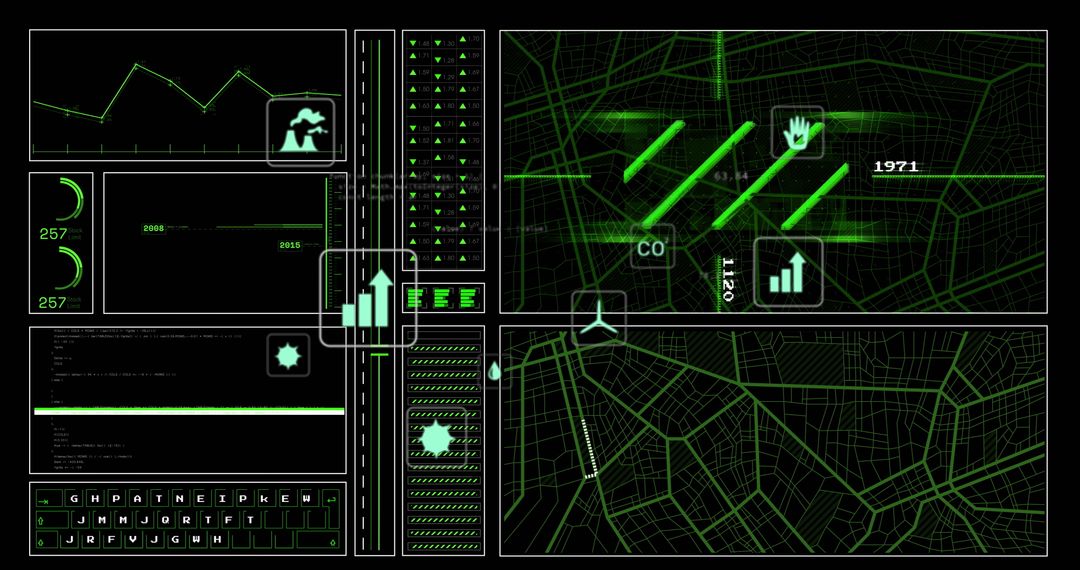
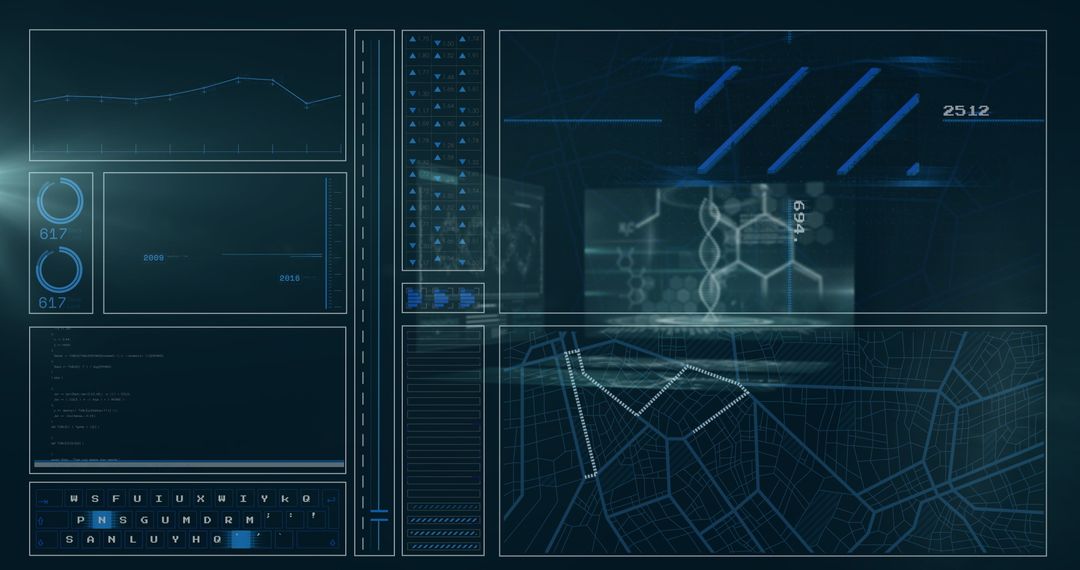
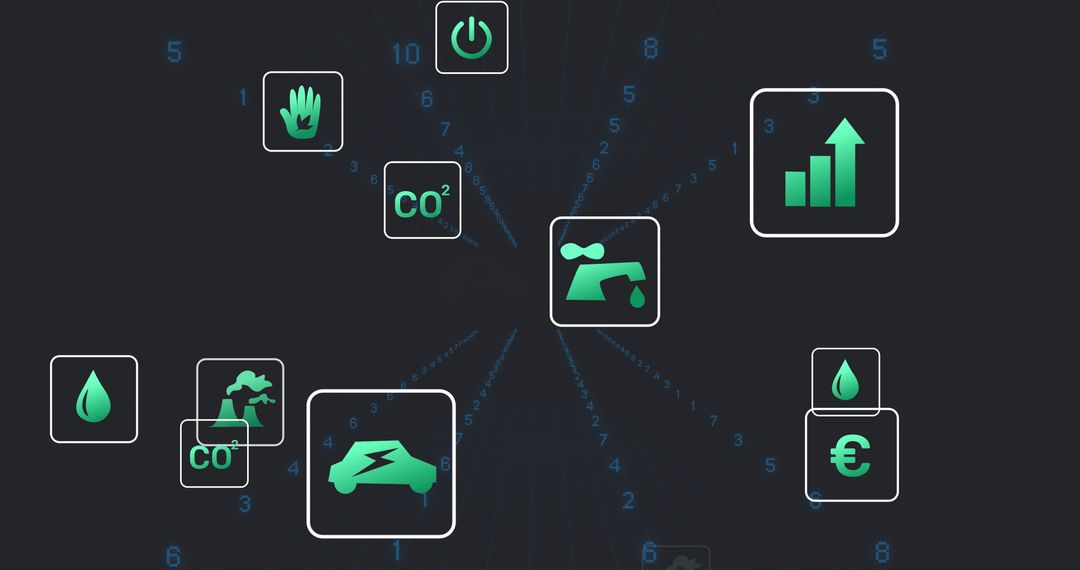
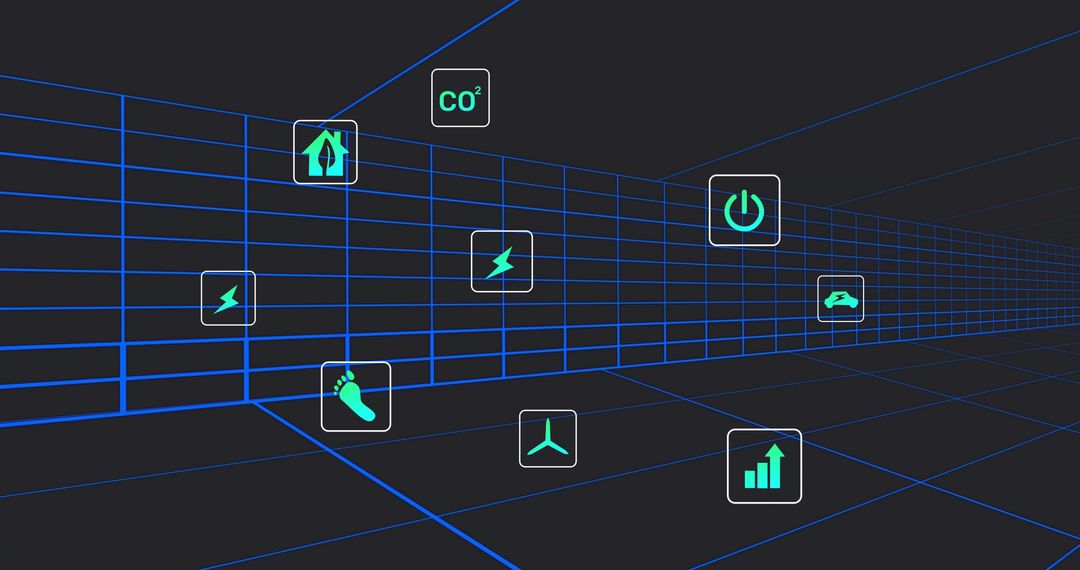
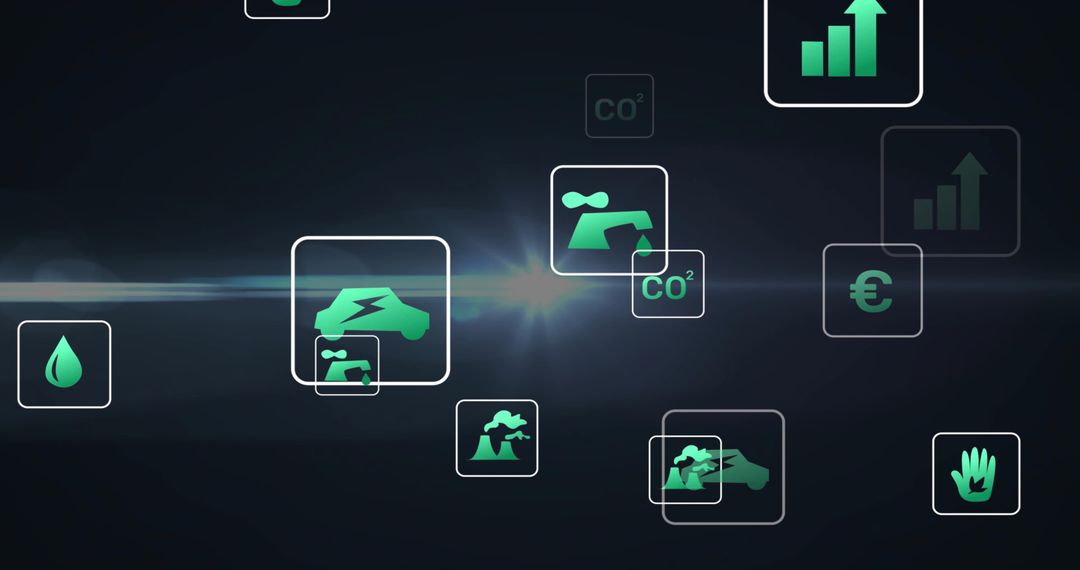
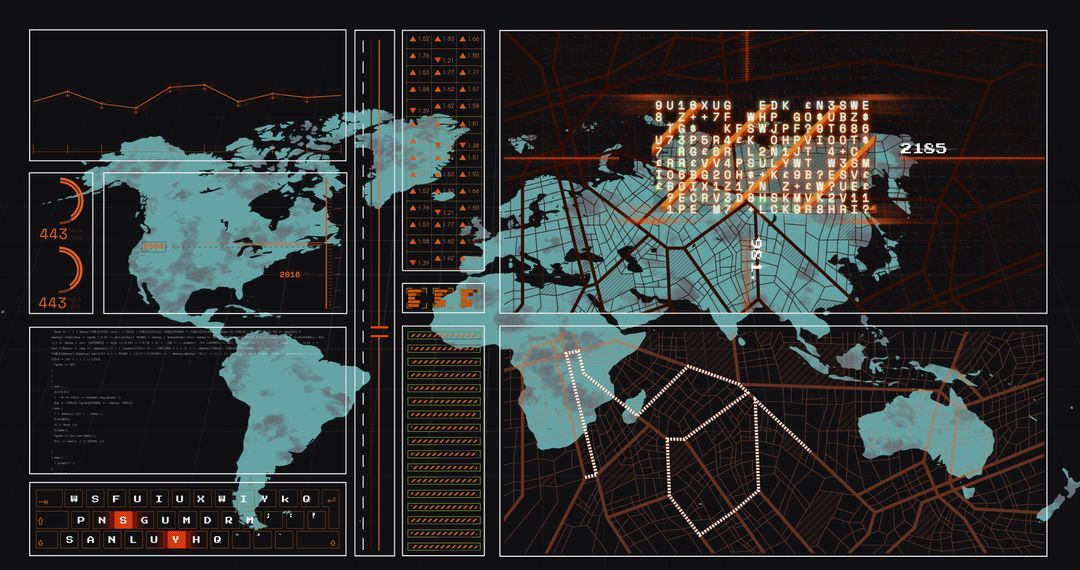
- Smart city dashboard displaying urban analytics, CO2 emissions and EV telemetry
Smart city dashboard displaying urban analytics, CO2 emissions and EV telemetry Image
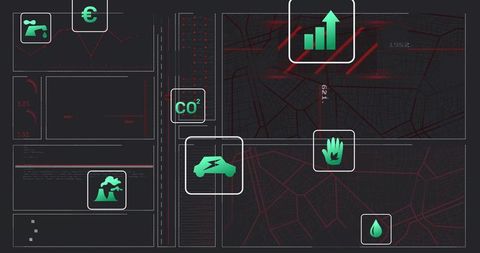
Featuring dark interface with map overlay, red grid lines and neon green icons representing CO2, electric vehicle, water droplet and safety hand. Central panels showing growth chart and EV symbol, side strips showing telemetry blocks and code-like data. Visual language conveying real time urban monitoring, emissions tracking, energy management and mobility analytics. Ideal for technology websites, smart city presentations, sustainability reports, investor pitch decks, UI concept galleries and editorial about climate analytics or transport electrification. Use as hero banner, background for data-driven slides, header for blog about EV adoption, illustration for environmental monitoring case studies or marketing for mobility startups. Suitable for cropping to focus on map area, icon set or chart; add overlay text, brand logo or data callouts on dark negative space.

downloads
Credit Photo
If you would like to credit the Photo, here are some ways you can do so
Free (free of charge)
Free for personal and commercial use.
Author: Creative Art
Similar Free Stock Images