
- Home >
- Stock Photos >
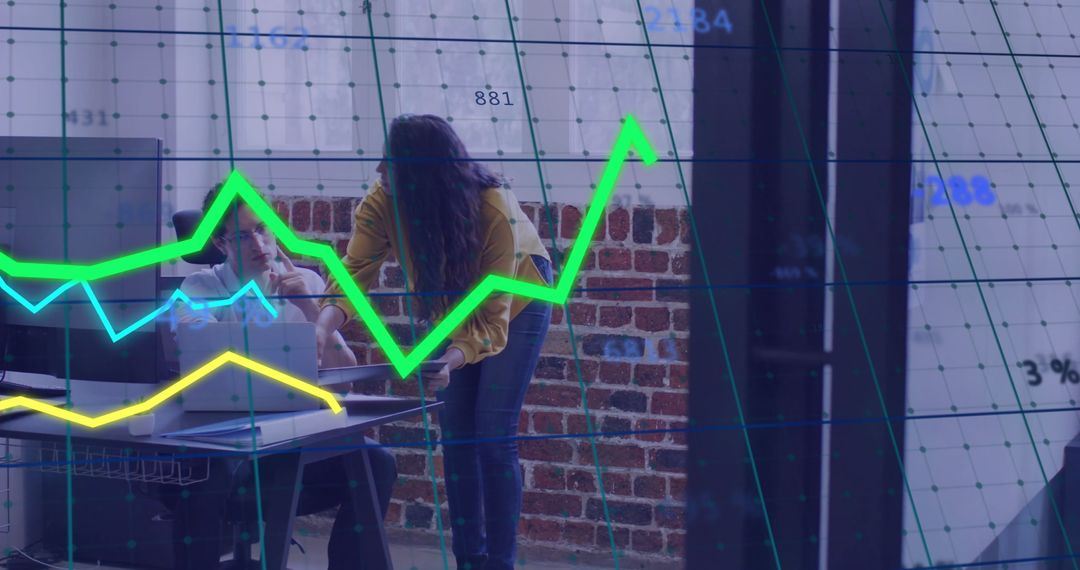
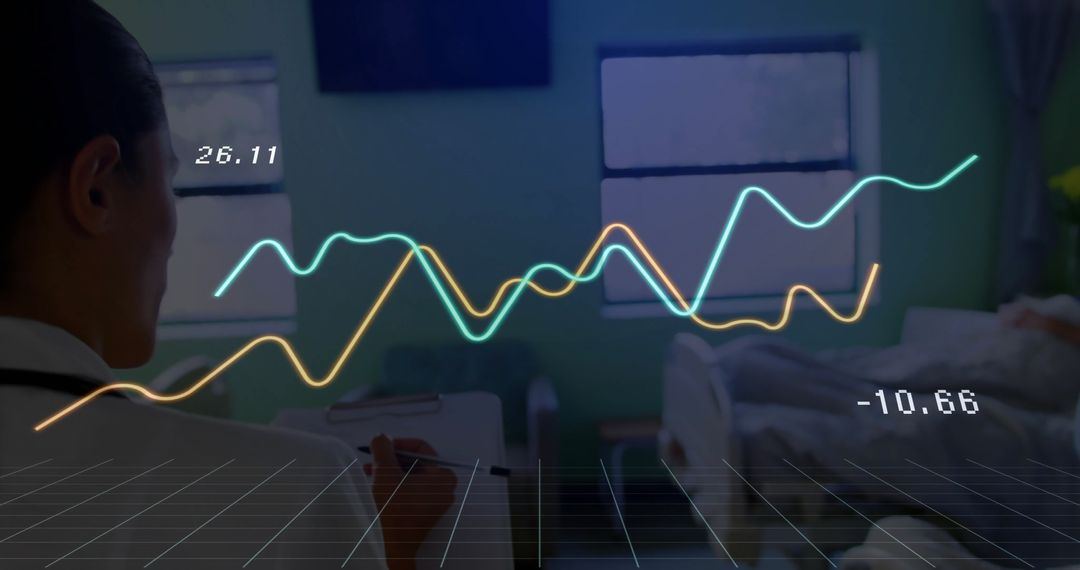
- Smiling Professional with Trend Lines in Business Analytics
Smiling Professional with Trend Lines in Business Analytics Image

Visual illustrating intersection of business analytics and professional life, with emphasis on data representation. Suitable for corporate presentations and technology websites.
Powered by  - Get 15% off with code: PIKWIZARD15


0
downloads
downloads
Tags:
More
Credit Photo
If you would like to credit the Photo, here are some ways you can do so
Text Link
photo Link
<span class="text-link">
<span>
<a target="_blank" href=https://pikwizard.com/photo/smiling-professional-with-trend-lines-in-business-analytics/95b7a5aa7e5281c792b6beeabff7f621/>PikWizard</a>
</span>
</span>
<span class="image-link">
<span
style="margin: 0 0 20px 0; display: inline-block; vertical-align: middle; width: 100%;"
>
<a
target="_blank"
href="https://pikwizard.com/photo/smiling-professional-with-trend-lines-in-business-analytics/95b7a5aa7e5281c792b6beeabff7f621/"
style="text-decoration: none; font-size: 10px; margin: 0;"
>
<img src="https://pikwizard.com/pw/medium/95b7a5aa7e5281c792b6beeabff7f621.jpg" style="margin: 0; width: 100%;" alt="" />
<p style="font-size: 12px; margin: 0;">PikWizard</p>
</a>
</span>
</span>
Free (free of charge)
Free for personal and commercial use.
Author: Awesome Content
Similar Free Stock Images

Premium


Premium


Premium


Premium


Premium


Premium


Premium


Premium


Premium


Premium


Premium


Premium


Premium


Premium


Premium


Premium


Premium


Premium


Premium


Premium


Premium


Premium


Premium


Premium

