- Home >
- Stock Photos >
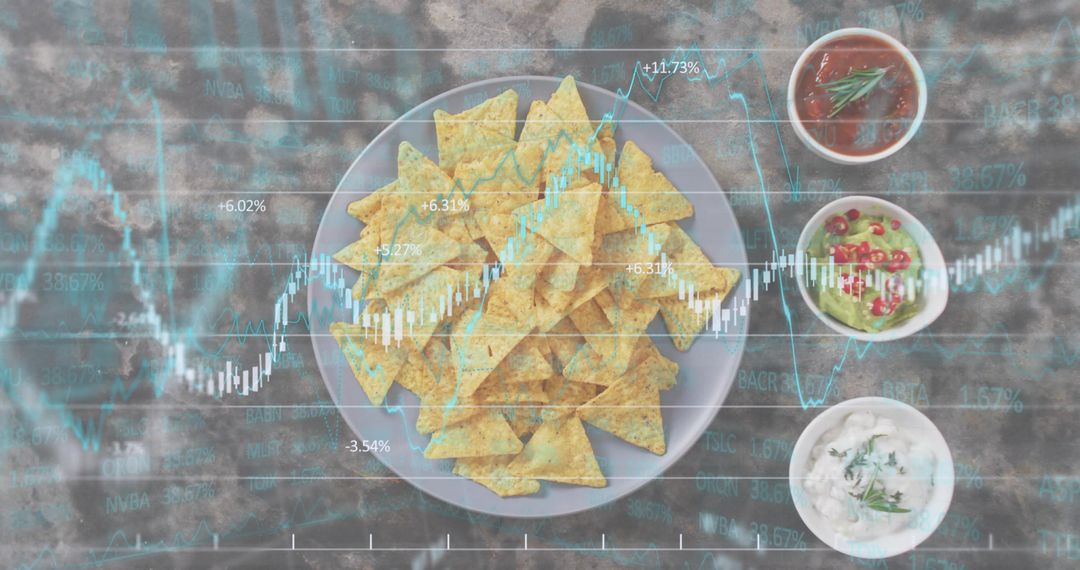
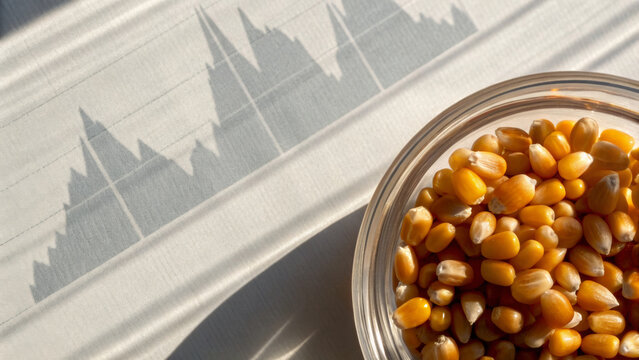
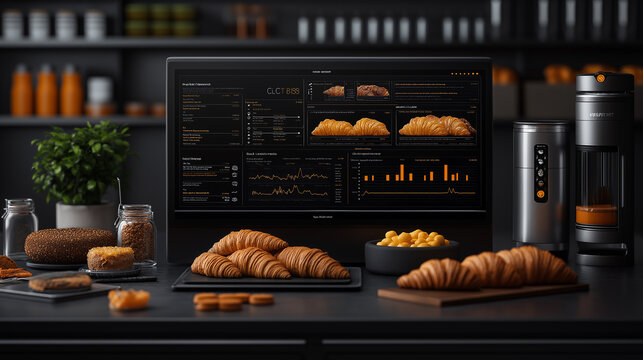
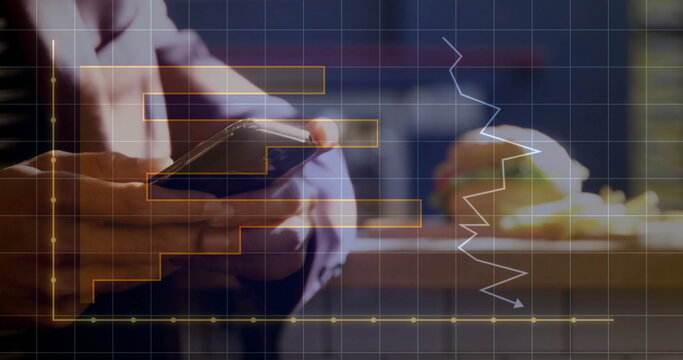
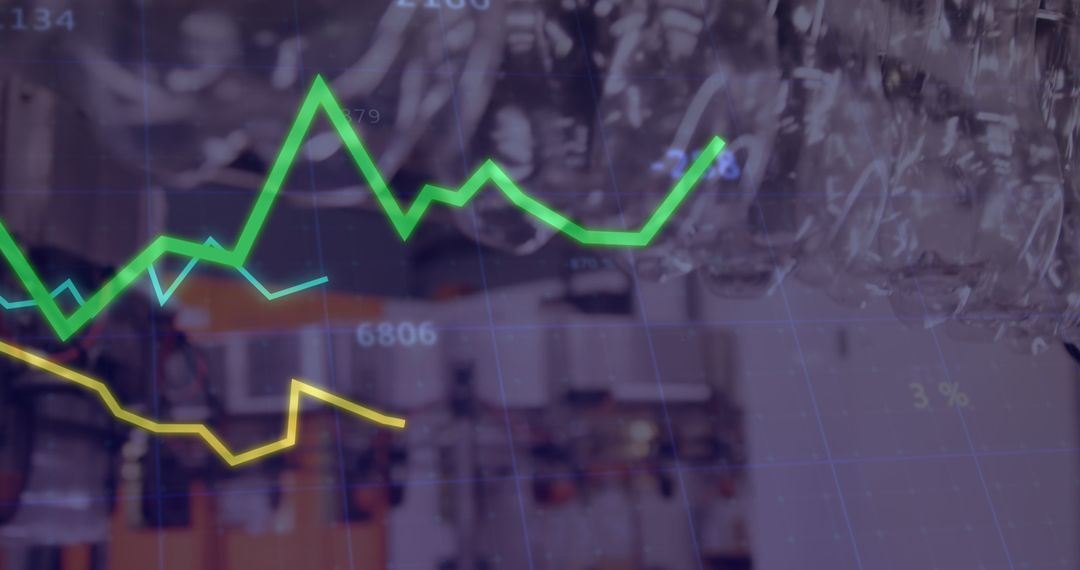
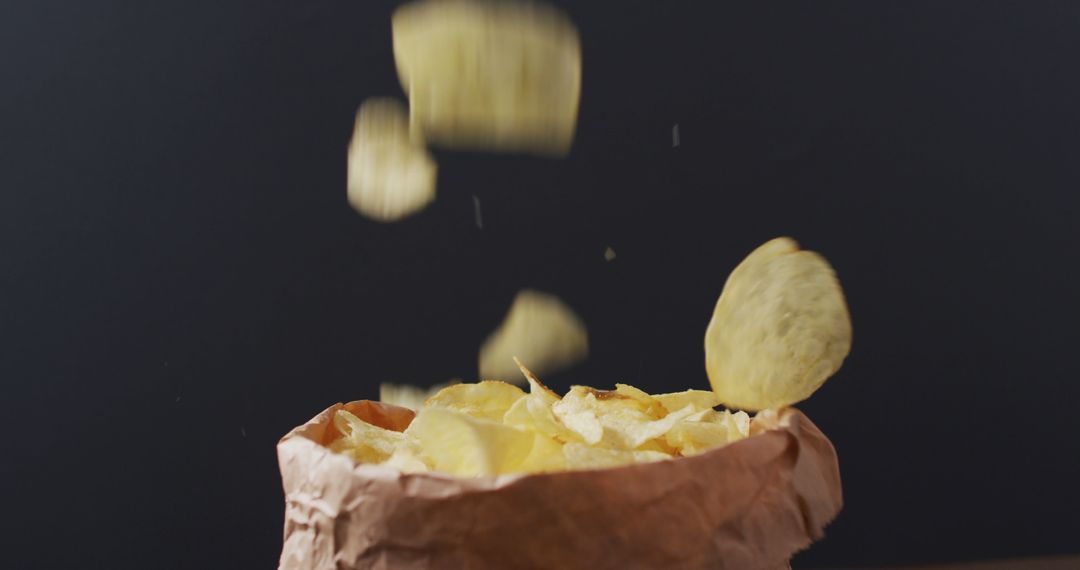
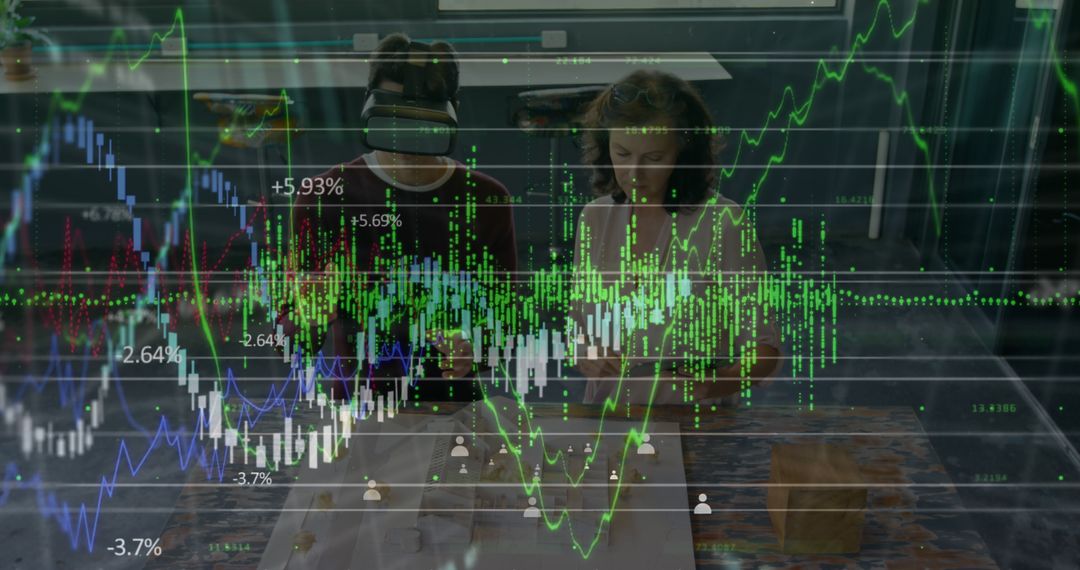
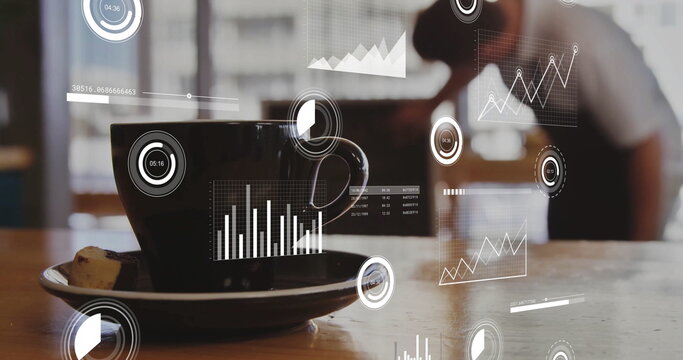
- Snack data visualization overlay on rustic wooden table with potato chips and ceramic bowl
Snack data visualization overlay on rustic wooden table with potato chips and ceramic bowl Image
Showing rustic wooden table strewn with potato chips and ceramic bowl while translucent data graphs overlaying scene. Combining food still life with business analytics, creating visual metaphor for snack industry sales and consumer trend storytelling. Featuring candlestick chart, line chart, histogram and grid elements in turquoise and navy tones, creating modern tech contrast with warm snack tones. Working well for food marketing presentations, consumer trend reports, packaging concept boards, social media campaigns, restaurant analytics articles, corporate pitch decks and blog headers. Leaving room for overlaying branding, headlines and data labels for custom infographics and editorial layouts.
Powered by 


0
downloads
downloads
Tags:
More
Credit Photo
If you would like to credit the Photo, here are some ways you can do so
Text Link
photo Link
<span class="text-link">
<span>
<a target="_blank" href=https://pikwizard.com/photo/snack-data-visualization-overlay-on-rustic-wooden-table-with-potato-chips-and-ceramic-bowl/738618feb1fff725e9e1443e2f2e83a3/>PikWizard</a>
</span>
</span>
<span class="image-link">
<span
style="margin: 0 0 20px 0; display: inline-block; vertical-align: middle; width: 100%;"
>
<a
target="_blank"
href="https://pikwizard.com/photo/snack-data-visualization-overlay-on-rustic-wooden-table-with-potato-chips-and-ceramic-bowl/738618feb1fff725e9e1443e2f2e83a3/"
style="text-decoration: none; font-size: 10px; margin: 0;"
>
<img src="https://pikwizard.com/pw/medium/738618feb1fff725e9e1443e2f2e83a3.jpg" style="margin: 0; width: 100%;" alt="" />
<p style="font-size: 12px; margin: 0;">PikWizard</p>
</a>
</span>
</span>
Free (free of charge)
Free for personal and commercial use.
Author: People Creations
Similar Free Stock Images

Premium


Premium


Premium


Premium


Premium


Premium


Premium

Premium


Premium


Premium


Premium


Premium