- Home >
- Stock Photos >
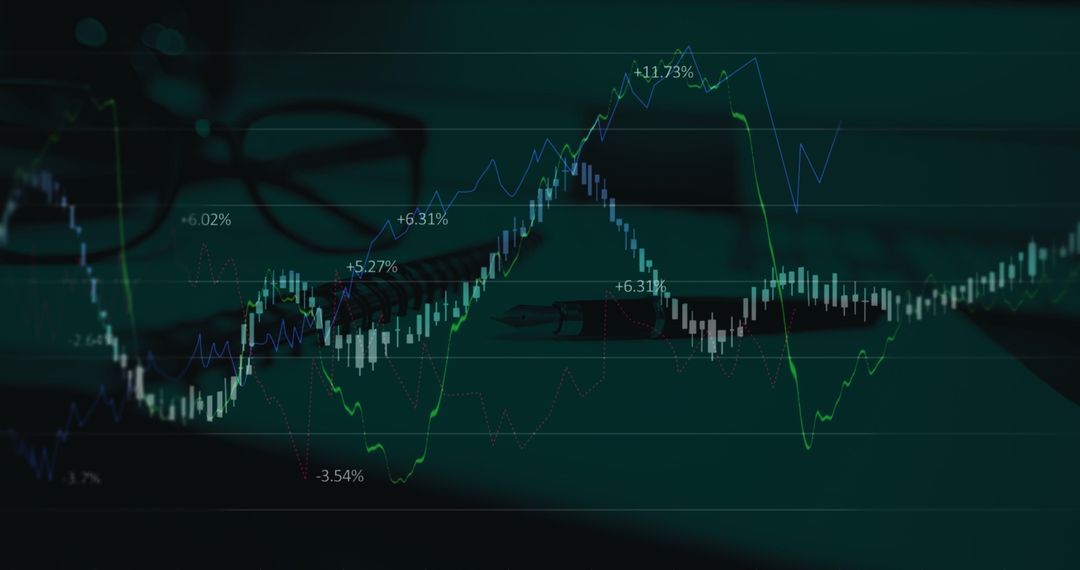
- Social Media Engagement Metrics Dashboard Visualization
Social Media Engagement Metrics Dashboard Visualization Image

Digital representation of social media activity displaying likes and engagement metrics within a dashboard interface. Visualization includes a purple grid and line chart illustrating data trends and analytics. Suitable for presentations on digital marketing strategies, online user engagement reports, or lectures about data science focused on social media performance.
Powered by 


0
downloads
downloads
Tags:
More
Credit Photo
If you would like to credit the Photo, here are some ways you can do so
Text Link
photo Link
<span class="text-link">
<span>
<a target="_blank" href=https://pikwizard.com/photo/social-media-engagement-metrics-dashboard-visualization/96bc33b05a476aa7d876209383cd2d5c/>PikWizard</a>
</span>
</span>
<span class="image-link">
<span
style="margin: 0 0 20px 0; display: inline-block; vertical-align: middle; width: 100%;"
>
<a
target="_blank"
href="https://pikwizard.com/photo/social-media-engagement-metrics-dashboard-visualization/96bc33b05a476aa7d876209383cd2d5c/"
style="text-decoration: none; font-size: 10px; margin: 0;"
>
<img src="https://pikwizard.com/pw/medium/96bc33b05a476aa7d876209383cd2d5c.jpg" style="margin: 0; width: 100%;" alt="" />
<p style="font-size: 12px; margin: 0;">PikWizard</p>
</a>
</span>
</span>
Free (free of charge)
Free for personal and commercial use.
Author: People Creations
Similar Free Stock Images

Premium


Premium


Premium


Premium


Premium


Premium


Premium


Premium


Premium


Premium


Premium


Premium


Premium


Premium


Premium


Premium


Premium


Premium


Premium


Premium


Premium


Premium


Premium


Premium