
- Home >
- Stock Photos >
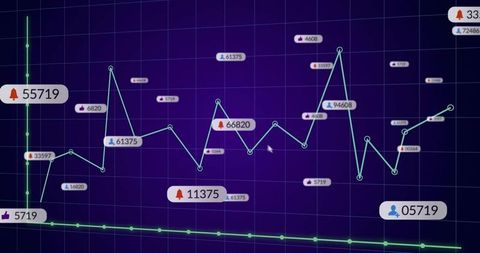
- Social Media Integration with Statistical Data Analysis
Social Media Integration with Statistical Data Analysis Image

Digital visualization depicting the convergence of social media platforms and statistical data analysis. The floating social media icons emphasize connectivity and online engagement, suitable for illustrating themes like digital marketing, data analytics, and business trends. Useful for presentations, reports, magazines, and blog articles exploring online strategy and data-driven decisions.
Powered by 


downloads
Tags:
More
Credit Photo
If you would like to credit the Photo, here are some ways you can do so
Text Link
photo Link
<span class="text-link">
<span>
<a target="_blank" href=https://pikwizard.com/photo/social-media-integration-with-statistical-data-analysis/3c7405fd97b00d02692865bcc55cbc32/>PikWizard</a>
</span>
</span>
<span class="image-link">
<span
style="margin: 0 0 20px 0; display: inline-block; vertical-align: middle; width: 100%;"
>
<a
target="_blank"
href="https://pikwizard.com/photo/social-media-integration-with-statistical-data-analysis/3c7405fd97b00d02692865bcc55cbc32/"
style="text-decoration: none; font-size: 10px; margin: 0;"
>
<img src="https://pikwizard.com/pw/medium/3c7405fd97b00d02692865bcc55cbc32.jpg" style="margin: 0; width: 100%;" alt="" />
<p style="font-size: 12px; margin: 0;">PikWizard</p>
</a>
</span>
</span>
Free (free of charge)
Free for personal and commercial use.
Author: Awesome Content
Similar Free Stock Images

Premium


Premium

Premium


Premium


Premium


Premium


Premium


Premium


Premium


Premium

Premium


Premium


Premium


Premium


Premium


Premium


Premium


Premium


Premium


Premium


Premium

Premium


Premium

Premium


Premium


Explore More Free Stock Images