
- Home >
- Stock Photos >
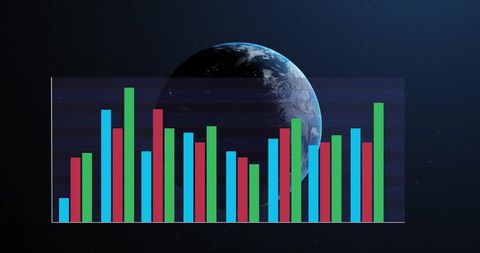
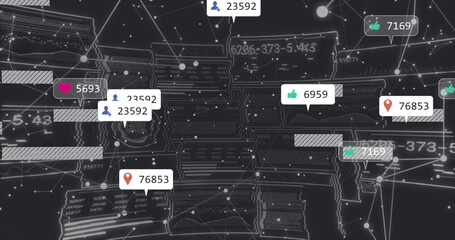
- Social Media Interaction Graph on Digital Network
Social Media Interaction Graph on Digital Network Image

This visual showcases a graph representing social media interactions such as likes, messages sent, and subscriptions on a digital network. It is ideal for use in presentations or articles targeting topics like social media trends, digital marketing strategies, communication improvements, or networking analytics. The design serves as a concept for user engagement metrics in online platforms.
Powered by 


2
downloads
downloads
Tags:
More
Credit Photo
If you would like to credit the Photo, here are some ways you can do so
Text Link
photo Link
<span class="text-link">
<span>
<a target="_blank" href=https://pikwizard.com/photo/social-media-interaction-graph-on-digital-network/d97f1ec7275872ae1dfe3cf529f93525/>PikWizard</a>
</span>
</span>
<span class="image-link">
<span
style="margin: 0 0 20px 0; display: inline-block; vertical-align: middle; width: 100%;"
>
<a
target="_blank"
href="https://pikwizard.com/photo/social-media-interaction-graph-on-digital-network/d97f1ec7275872ae1dfe3cf529f93525/"
style="text-decoration: none; font-size: 10px; margin: 0;"
>
<img src="https://pikwizard.com/pw/medium/d97f1ec7275872ae1dfe3cf529f93525.jpg" style="margin: 0; width: 100%;" alt="" />
<p style="font-size: 12px; margin: 0;">PikWizard</p>
</a>
</span>
</span>
Free (free of charge)
Free for personal and commercial use.
Author: Awesome Content
Similar Free Stock Images
Loading...

Premium


Premium


Premium


Premium


Premium

Premium


Premium

Premium


Premium


Premium


Premium


Premium

Premium


Premium

Premium


Premium


Premium


Premium

Premium


Premium


Premium


Premium


Premium


Premium


Premium

