
- Home >
- Stock Photos >
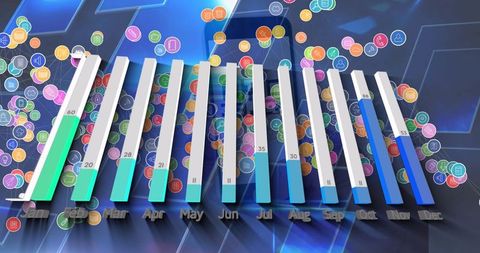
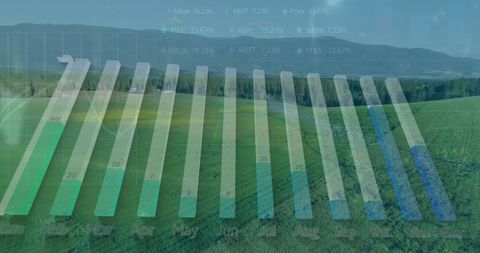
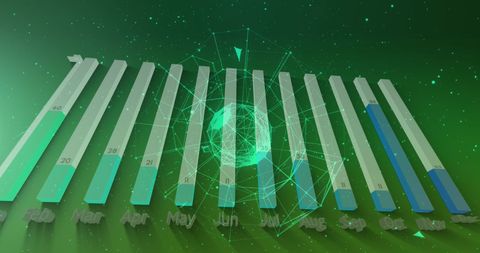
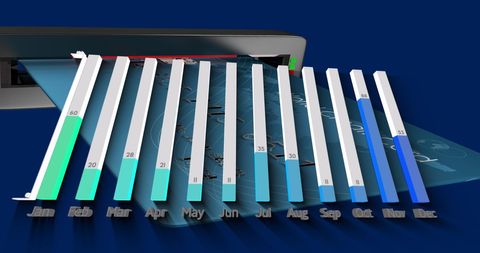
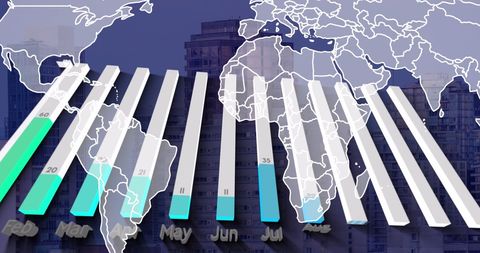
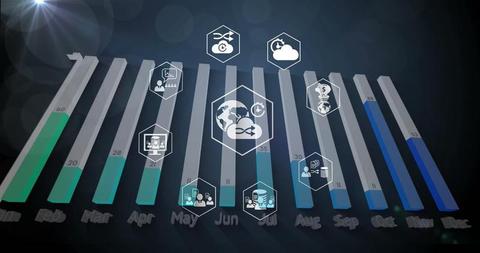
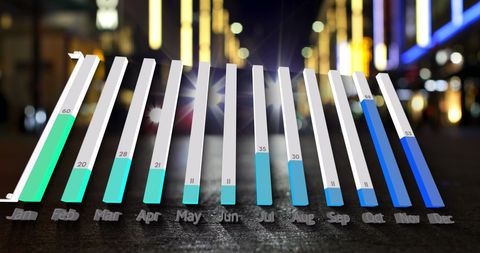
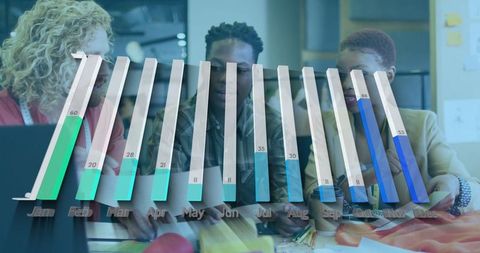
- Social Media Interaction Overview with Monthly Statistics
Social Media Interaction Overview with Monthly Statistics Image
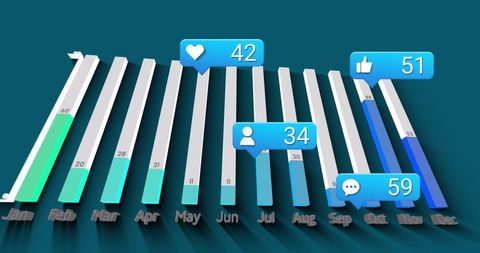
Graph shows monthly statistics with various interaction icons like heart, thumbs up, and comment. Blue bars represent social engagement over twelve months. Useful for presentations on social media strategies, online growth tracking, or data analysis tools.
Powered by  - Get 15% off with code: PIKWIZARD15


2
downloads
downloads
Tags:
More
Credit Photo
If you would like to credit the Photo, here are some ways you can do so
Text Link
photo Link
<span class="text-link">
<span>
<a target="_blank" href=https://pikwizard.com/photo/social-media-interaction-overview-with-monthly-statistics/c318f0504d1336a2ae397f0082587c78/>PikWizard</a>
</span>
</span>
<span class="image-link">
<span
style="margin: 0 0 20px 0; display: inline-block; vertical-align: middle; width: 100%;"
>
<a
target="_blank"
href="https://pikwizard.com/photo/social-media-interaction-overview-with-monthly-statistics/c318f0504d1336a2ae397f0082587c78/"
style="text-decoration: none; font-size: 10px; margin: 0;"
>
<img src="https://pikwizard.com/pw/medium/c318f0504d1336a2ae397f0082587c78.jpg" style="margin: 0; width: 100%;" alt="" />
<p style="font-size: 12px; margin: 0;">PikWizard</p>
</a>
</span>
</span>
Free (free of charge)
Free for personal and commercial use.
Author: Awesome Content
Similar Free Stock Images
Loading...

Premium

Premium


Premium


Premium


Premium


Premium
Premium


Premium
Premium

Premium


Premium


Premium


Premium

Premium


Premium


Premium

Premium


Premium


Premium


Premium


Premium


Premium


Premium


Premium


Premium
