- Home >
- Stock Photos >
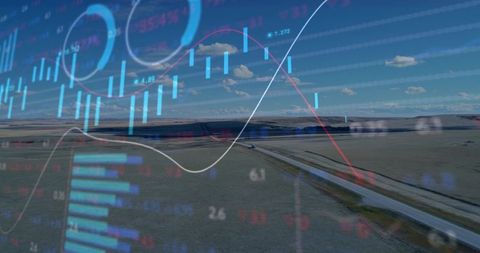
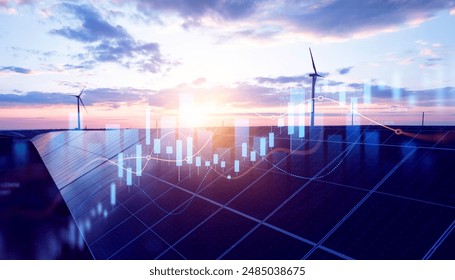
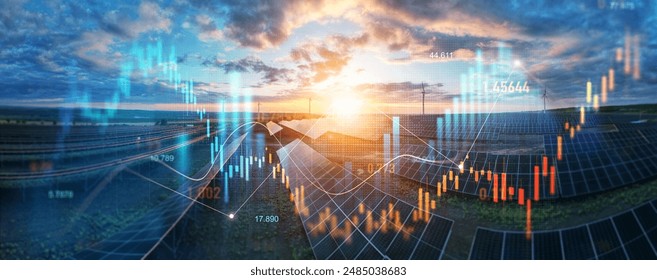
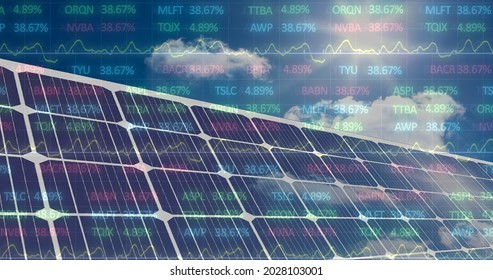
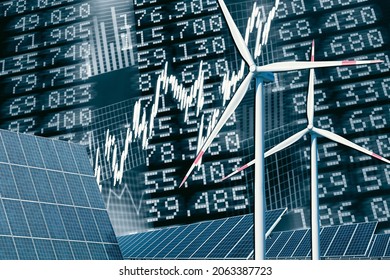
- Solar Energy Integration in Financial Markets Visualization
Solar Energy Integration in Financial Markets Visualization Image

Visual representation highlights interplay between solar energy and financial data using graphics. Perfect for articles or presentations focused on investments in renewable energy, technological advances in sustainability, and the intersection of green energy with economic trends. Suitable for use by educational platforms, investment firms, and media outlets intent on illustrating data analysis in context of the solar industry.
Powered by  - Get 15% off with code: PIKWIZARD15


downloads
Tags:
More
Credit Photo
If you would like to credit the Photo, here are some ways you can do so
Text Link
photo Link
<span class="text-link">
<span>
<a target="_blank" href=https://pikwizard.com/photo/solar-energy-integration-in-financial-markets-visualization/024ea42be18d7e0b8132b8977a5af856/>PikWizard</a>
</span>
</span>
<span class="image-link">
<span
style="margin: 0 0 20px 0; display: inline-block; vertical-align: middle; width: 100%;"
>
<a
target="_blank"
href="https://pikwizard.com/photo/solar-energy-integration-in-financial-markets-visualization/024ea42be18d7e0b8132b8977a5af856/"
style="text-decoration: none; font-size: 10px; margin: 0;"
>
<img src="https://pikwizard.com/pw/medium/024ea42be18d7e0b8132b8977a5af856.jpg" style="margin: 0; width: 100%;" alt="" />
<p style="font-size: 12px; margin: 0;">PikWizard</p>
</a>
</span>
</span>
Free (free of charge)
Free for personal and commercial use.
Author: Awesome Content
Similar Free Stock Images
Loading...

Premium


Premium

Premium


Premium

Premium


Premium


Premium

Premium

Premium


Premium
Premium


Premium
Premium


Premium


Premium


Premium


Premium

Premium


Premium

Premium


Premium


Premium


Premium

Premium

Premium