
- Home >
- Stock Photos >
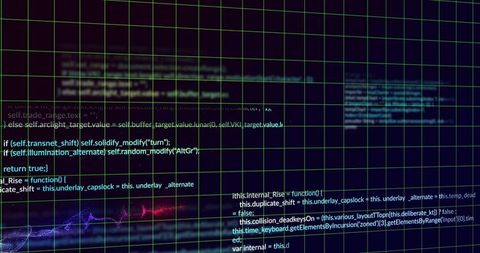
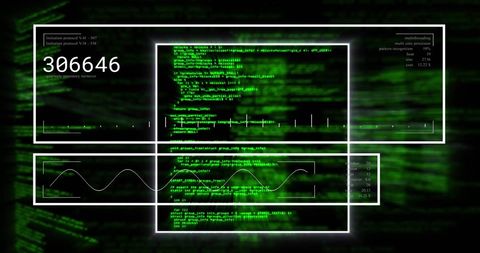
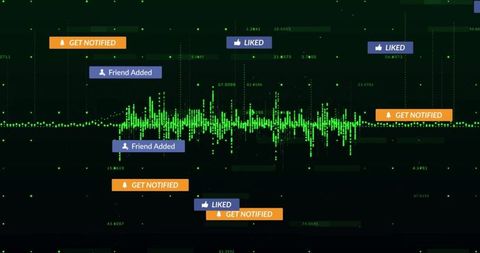
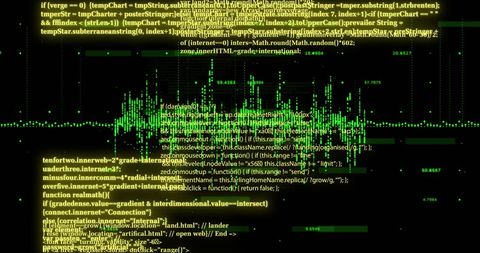
- Sound Wave Visualization with Programming Code Elements
Sound Wave Visualization with Programming Code Elements Image

A vibrant digital scene merges soundwaves with visible programming code in shades of green. The image captures the essence of modern technology, combining sound interpretation with data and coding. Ideal for illustrating concepts in software development, digital sound processing, innovation, and information technology presentations or articles.
Powered by  - Get 15% off with code: PIKWIZARD15


downloads
Tags:
More
Credit Photo
If you would like to credit the Photo, here are some ways you can do so
Text Link
photo Link
<span class="text-link">
<span>
<a target="_blank" href=https://pikwizard.com/photo/sound-wave-visualization-with-programming-code-elements/fdc8446e85d1fd6bf2cfd5db98e40f03/>PikWizard</a>
</span>
</span>
<span class="image-link">
<span
style="margin: 0 0 20px 0; display: inline-block; vertical-align: middle; width: 100%;"
>
<a
target="_blank"
href="https://pikwizard.com/photo/sound-wave-visualization-with-programming-code-elements/fdc8446e85d1fd6bf2cfd5db98e40f03/"
style="text-decoration: none; font-size: 10px; margin: 0;"
>
<img src="https://pikwizard.com/pw/medium/fdc8446e85d1fd6bf2cfd5db98e40f03.jpg" style="margin: 0; width: 100%;" alt="" />
<p style="font-size: 12px; margin: 0;">PikWizard</p>
</a>
</span>
</span>
Free (free of charge)
Free for personal and commercial use.
Author: Authentic Images
Similar Free Stock Images

Premium


Premium

Premium


Premium


Premium


Explore More Free Stock Images