- Home >
- Stock Photos >
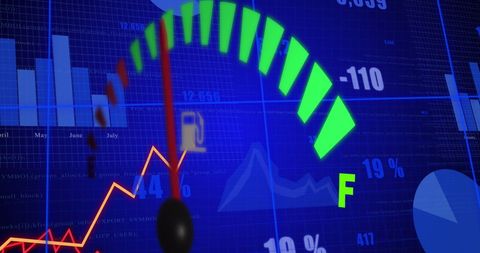
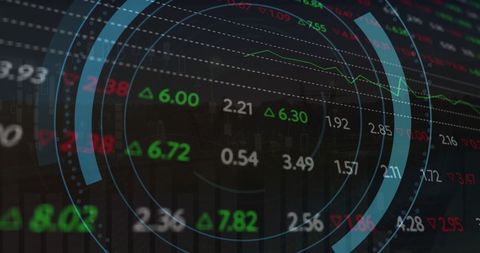
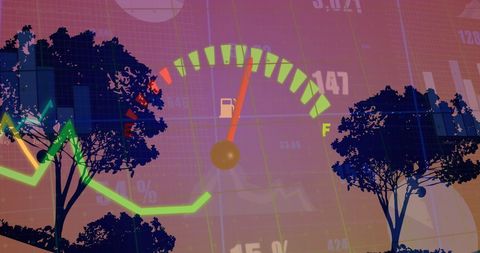
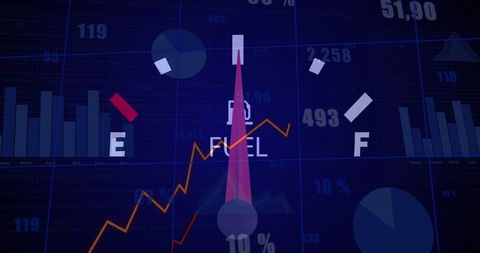
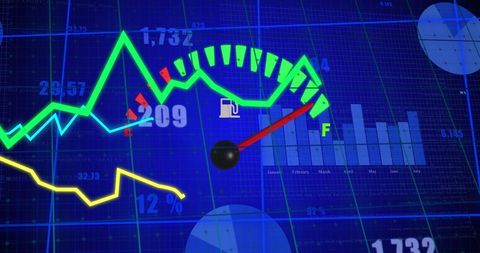
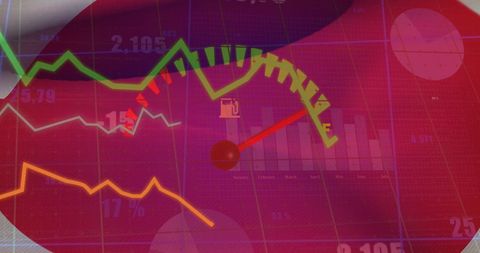
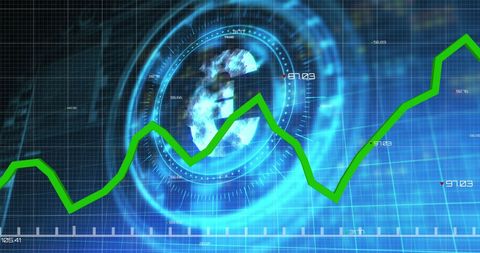
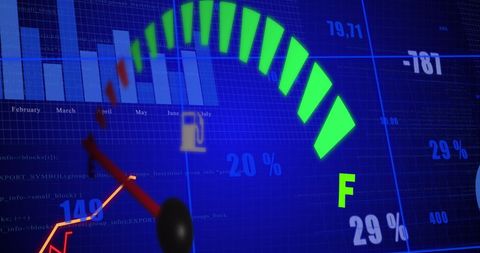
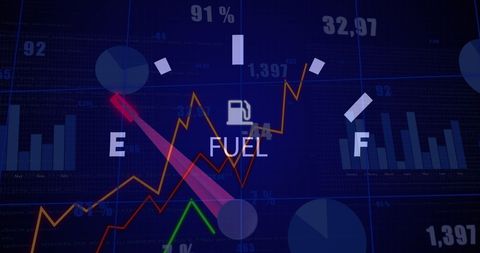
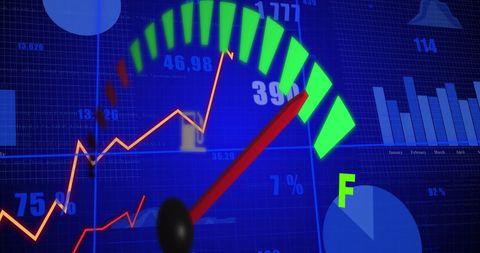
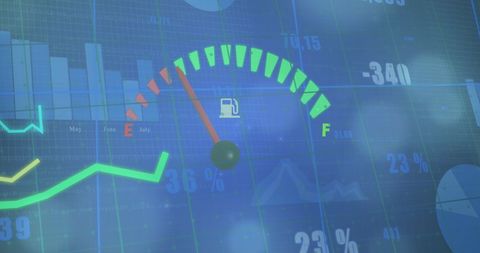
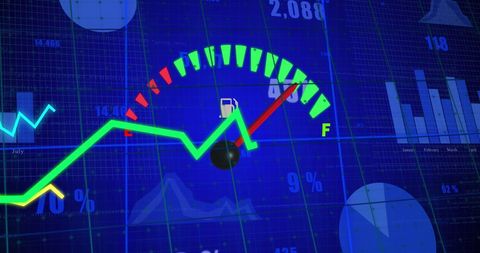
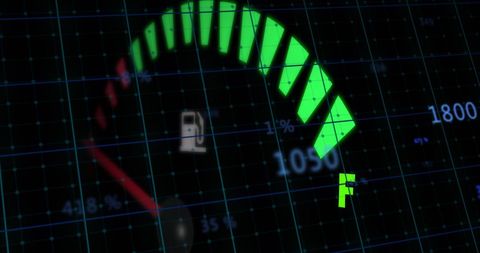
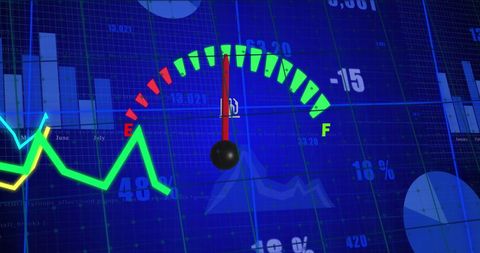
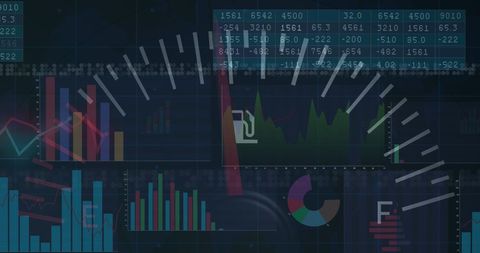
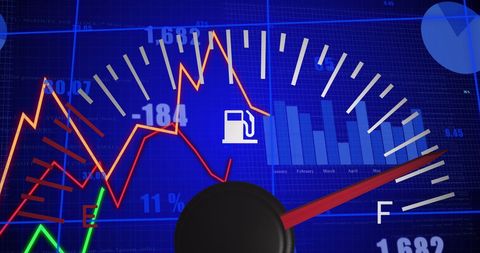
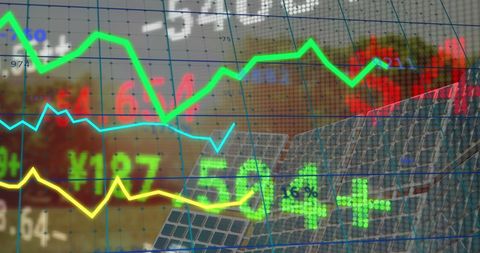
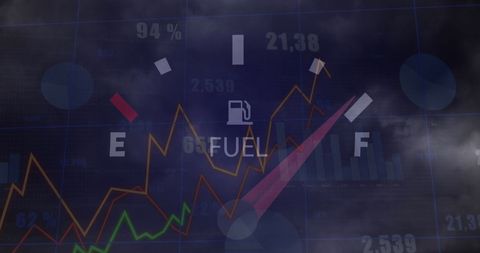
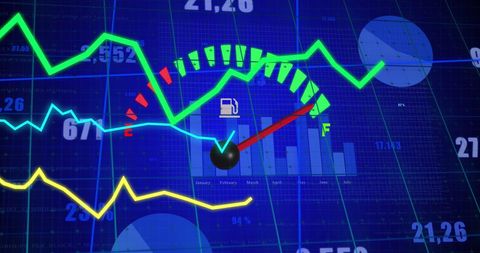
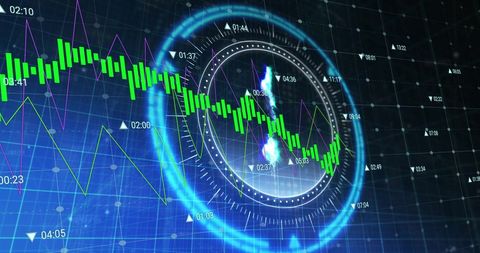
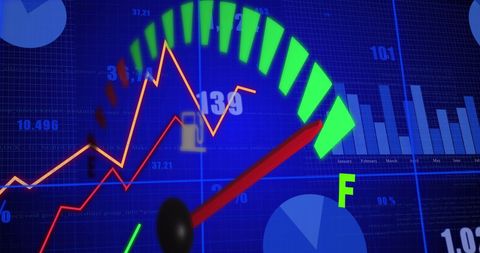
- Speedometer Blending with Graph Data Visualization Concept
Speedometer Blending with Graph Data Visualization Concept Image
Speedometer blending with graph visualizations and clouds symbolizes the convergence of auto engineering and business analytics. This concept is ideal for illustrating technological advancements in vehicle data, insight on data analysis techniques transferrable to automotive technology, or depicting trends in business operations.

downloads
Tags:
More
Credit Photo
If you would like to credit the Photo, here are some ways you can do so
Text Link
photo Link
<span class="text-link">
<span>
<a target="_blank" href=https://pikwizard.com/photo/speedometer-blending-with-graph-data-visualization-concept/908d0007cbb00c067e0b20112314e72a/>PikWizard</a>
</span>
</span>
<span class="image-link">
<span
style="margin: 0 0 20px 0; display: inline-block; vertical-align: middle; width: 100%;"
>
<a
target="_blank"
href="https://pikwizard.com/photo/speedometer-blending-with-graph-data-visualization-concept/908d0007cbb00c067e0b20112314e72a/"
style="text-decoration: none; font-size: 10px; margin: 0;"
>
<img src="https://pikwizard.com/pw/medium/908d0007cbb00c067e0b20112314e72a.jpg" style="margin: 0; width: 100%;" alt="" />
<p style="font-size: 12px; margin: 0;">PikWizard</p>
</a>
</span>
</span>
Free (free of charge)
Free for personal and commercial use.
Author: Awesome Content