1. Home > 
  2. Stock Photos > 
  3. Spinning Geometric Shape Over Financial Data Visualization

Spinning Geometric Shape Over Financial Data Visualization Image

Spinning Geometric Shape Over Financial Data Visualization

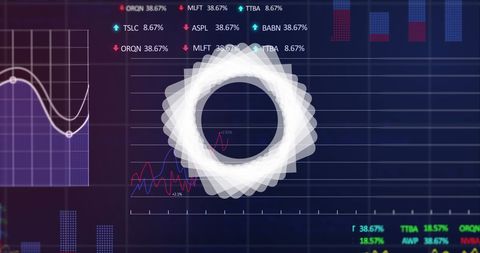
Visual depicts abstract white geometric shape rotating over layered charts and financial data on blue background. Keywords like TSLC and specific percentage values embody dynamic elements of global stock market trends, creating sense of technological focus. Great for business presentations, financial analysis materials, or modern technology visuals emphasizing global economy or investment themes.

Powered by Adobe logo
A black and white spherical optical illusion swirls across a white background - Powered by AdobeVibrant spiral circle design abstract background image abstract art features vibrant spirals and prominent circle design - Powered by AdobeGlowing crystalline orb with internal spinning core emits vibrant radial energy, surrounded by floating geometric shapes in colorful, futuristic setting - Powered by AdobeColorful abstract vortex with swirling geometric shapes. - Powered by AdobeAbstract Design With Spiral And Swirl Motions Creating Twisting Circles Element. A Dynamic And Visually Captivating Element Full Of Movement And Energy. - Powered by Adobe

Credit Photo

If you would like to credit the Photo, here are some ways you can do so

Free (free of charge)

Free for personal and commercial use.

Author: Authentic Images

Similar Free Stock Images

Dynamic Financial Data Display in Digital Space
Premium
Green low poly geometric sphere spinning slowly, showcasing contemporary digital design against transparent backdrop
Digital Stock Market Trends and Financial Growth Analysis
Digital Interface with Virtual Data Surging Across Connection Globes
Financial Data Flow against Urban Skyline Backdrop
Fluctuating Graph on Green Grid Background Illustrating Financial Trends
Premium
pink and red spinning top spinning on a wooden table
Futuristic Digital Interface Analyzing Stock Market Trends
Digital Financial Data Visualization with Futuristic Elements
Abstract Triangle Over Financial Data and Graphs
Analyzing Accelerating Data Trends on Grid with Tech Insights
Premium
A close-up of a spiral staircase, viewed from directly above or below, creating a mesmerizing geometric pattern of light and shadow, architectural beauty, abstract and dynamic.
Digital Financial Data Analysis with Infographics and Charts
Rising Graphs and Interactive Financial Data Analytics Background
Dynamic Financial Graph with Rising Trend on Blue Background
Digital Data Analysis Interface with Graphs and Scope
Premium
Empty room, Abstract spinning metal spiral, hypnotic effect. Design. Endless motion of metal tiles or blades.
Dynamic Data Visualization with Financial Charts and 3D Elements
Dynamic Financial Data Visualization on Digital Grid Background
Abstract Digital Charts with Social Media Metrics Rising
Futuristic Data Loading Interface with Dynamic Graphs
Premium
Vibrant colored cubes dynamically suspended above a textured pedestal creating a sense of motion and innovation
Dynamic Financial Graphs and Data Analysis Interface
Dynamic Digital Graph Showing Global Data Movement
Digital Cityscape with Financial Data Overlay
Dynamic Stock Market Analysis Concept Artwork
Premium
Abstract White Sphere with Geometric Shapes
Stock Market Analysis with Graphs and Trading Data
Abstract Financial Data Processing and Analysis Interface
Financial Data Processing with Chart and Dark Grid Background
Dynamic Global Financial Data with Multicolored Graph Lines
Premium
Golden dodecahedron spinning smoothly, revealing geometric precision with luminous reflections on pristine transparent backdrop
Digital Finance Network with Rotating Globe Interface
Dynamic Financial Data Graphs Networking in Global Business
Premium
Abstract glowing green arrows forming a circular pattern on black background
Financial Data Charts with World Map on Blue Digital Background
Financial Visualization Overlooking Urban Cityscape
Fluctuating Financial Graph with Red Line on Green Grid
Dynamic Financial Graphs Illustrating Market Trends
Premium
Abstract spinning machinery
Dynamic Stock Market Data Visualization on Digital Screen
Fluctuating Digital Stock Market Data Chart
Colorful Data Visualization Graphs on Digital Grid
Digital Financial Data Analysis with Graphs and Stock Market Trends
Premium
Abstract Spiral Swirl Design on Blue Background Modern, Minimalist Art for Visuals, Backgrounds, and Graphic Projects.
Futuristic Stock Market Data Visualization Technology
Eco-Friendly Icons Overlaid on Rising Stock Market Graph
Digital Data Visualization with Trend Lines and Percentage Changes
Stock Market Data Analysis with Graphs and Metrics
Premium
A spinning top in a dark concrete room with columns and a light at the end of the tunnel
Neon Digital Interface with Financial Data Analytics
Digital Financial Analysis and Data Visualization Concept
Futuristic Keyboard Analytics Display with Digital Graphs and Numbers
Dynamic Financial Data Against Urban Skyline
Premium
Vibrant kaleidoscope of health access keys spinning
Abstract Digital Stock Market Analysis with Graphs
Data Processing Interface with Digital Financial Trends Overlay
Financial Data Analysis with Interactive Graphs
Global Financial Data Analysis with Colorful Graphs
Premium
Hypnotic vortex of black and white geometric shapes creating a spiral tunnel. Abstract optical illusion background.
Financial Graph with Data Analysis and Market Statistics
Fluctuating Stock Market Graph with Dramatic Peaks
Digital Visualization of Global Networking with Statistical Graphs
Dynamic Stock Market Graphs Indicating Financial Trends
Digital Financial Data and Global Business Analytics
Financial Data Visualization with Cityscape Overlay
Premium
The intricate grooves of a black vinyl record, captured with a macro lens, with the stylus needle sitting in a groove, the physics of sound, abstract and detailed, high contrast.ec898ae01a12
Digital Financial Graph with Rising Line Trend on Dark Background
Dynamic Line Chart with Histogram on Digital Grid Background
Rising Digital Graph and Data Visualizations on Black Background
Financial Stock Market Data Analysis on Digital Interface
Premium
A collection of 36 unique, dark-grey spiral designs on a white background; various styles, thicknesses, and dot patterns
Digital Ruble Symbol with Data Graph Overlay
Digital Financial Data Processing Interface on Red Background
Dynamic Financial Charts and Graphs Indicating Market Trends
Dynamic Financial Growth Digital Chart Display
Premium
3D Transparent Geometric Forms Spinning in Motion
Abstract Neon Data Visualization with Circular Elements
Financial Data Analysis in Digital Interface with Graphs
Financial Growth Graph and Data Analytics Representation
Global Financial Trends and Digital Data Visualization Concepts
Premium
Four composite views showing icy, crystallized structures swirling and framing dark voids
Digital Data Processing Interface with Graph Analysis
Holographic Financial Data Visualization with Stock Trends
Neon Infinity Symbol Overlaying Financial Statistics Background
Digital Chart Display Financial Data Analysis Background Effects
Premium
A white spinning top toy isolated on a dark gray background in a studio shot with soft lighting
Global Financial Data Processing with Digital Interface Elements
Dynamic Red Line Graph Over Green Grid Background
Dynamic Financial Data Overlaid on Grid Background
Futuristic Graph and Data Technology Interface
Premium
A modern illustration of a spinning dreidel with Stars of David. This festive graphic evokes the spirit of Hanukkah. Ideal for holiday cards, banners, and cultural content.
Dynamic Financial Graph Displaying Market Trends
Digital Data Visualization with Circular Interface Elements
Dynamic Digital Stock Market Ticker with Growing Graph Trends
Financial Data Streaming with Arrows Over Graphic Indicators
World Map with Falling Line Graphs Indicating Global Economic Decline
Financial Chart and Rotating Globe on Digital Grid Background
Premium
Glowing lines and geometric figures with dark back.
Digital Financial Data Analysis with Graph and HUD Interface
Futuristic Interface with Data Trends and Diverging Charts
Dynamic Financial Data Processing with Futuristic Graphic Interface
Digital Finance: Modern Stock Market Analysis Display
Premium
Abstract swirling concentric circles in red and blue hues.
Data Security with Tech Bar Graph Overlay
Analyzing Data Trends on Digital Graph Interface
Digital Financial Data Overlay on Urban Street Scene
Digital Data Scanning with Global Financial Analytics Interface
Premium
Abstract Black Spinning Top Sculpture on Rippled Surface Dark Minimalist 3D Render
Financial Data Processing with Rising Graphs
Futuristic Technology Interface with Digital Financial Graphs
Rising Financial Data Graph on Digital Grid Background
Digital Finance Analysis: Interactive Data Visualization on Screen
Premium
Colorful blurred abstract geometric texture suitable for label design, editorial header background
Cybersecurity Data Processing with Digital Analytics
Digital Data Visualization and Analysis Interface
Financial Data Graph Over Cityscape with Digital Overlay
Holographic Financial Stock Market Analysis Visualization
Premium
Close-up of a spiral shaped object.
Dynamic Red Line Graph With Data Points on Gridded Background
Dynamic Display of Financial Graphs and Stock Market Data
Digital Data Processing with Technology Interface on Blue Background
Global Data Visualization With Dynamic Graphs and World Map Background
Premium
Stylized illustration of a spinning top with a yellow and black design.
Rotating Overlapping Neon Rings on Futuristic HUD Grid with Crosshair and Alpha Beta Labels