- Home >
- Stock Photos >
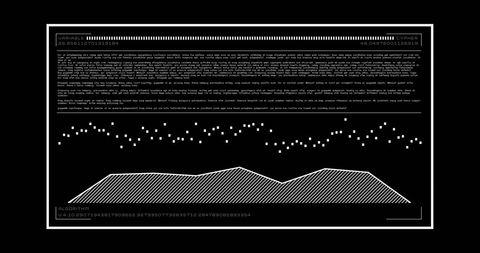
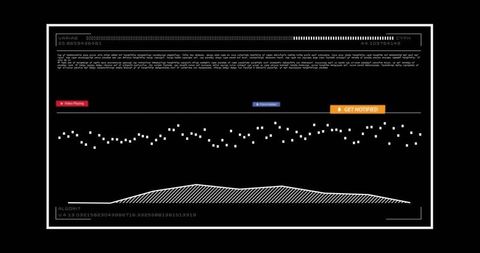
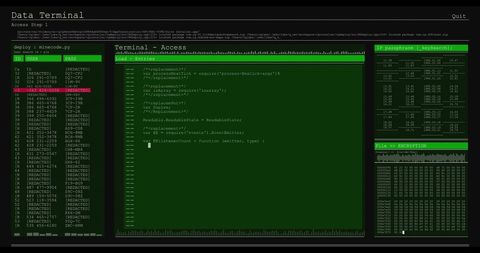
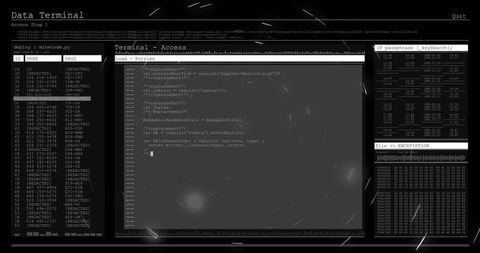
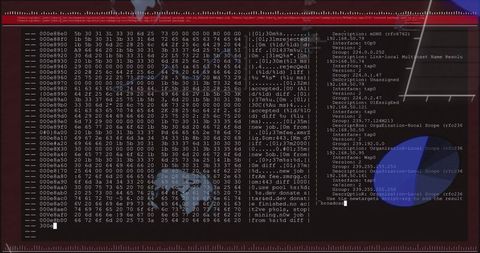
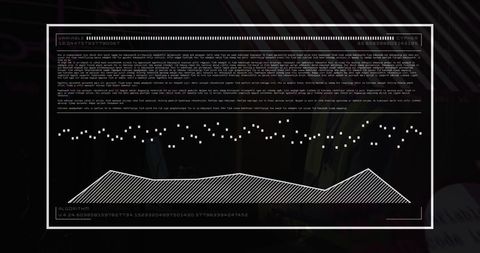
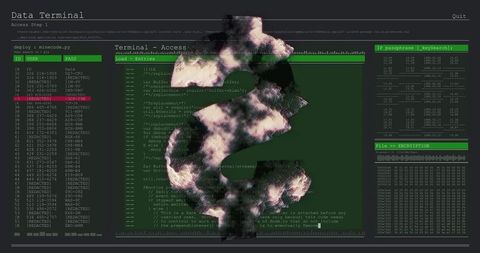
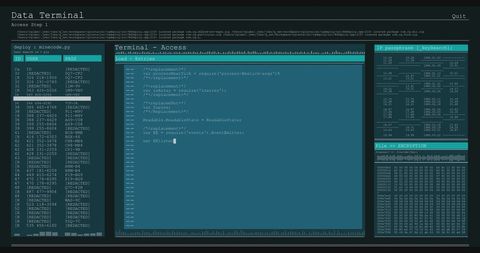
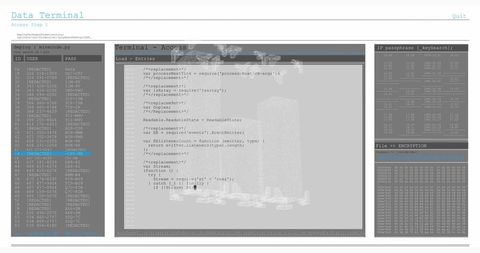
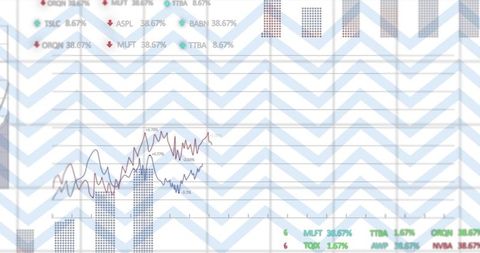
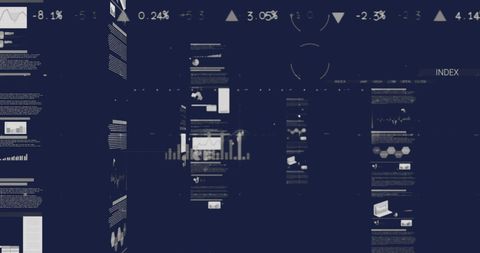
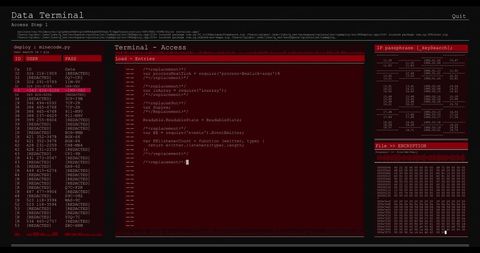
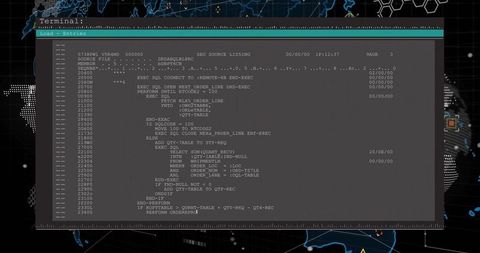
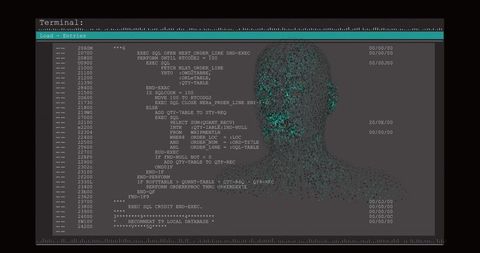
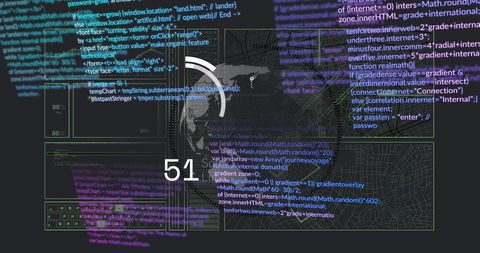
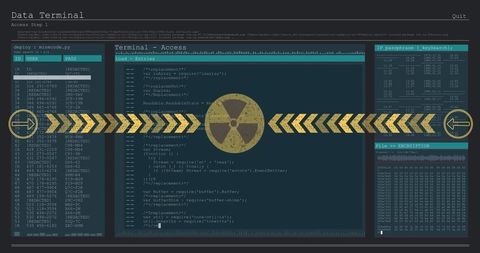
- SQL Coding on Digital Interface with Data Visualization and Analysis
SQL Coding on Digital Interface with Data Visualization and Analysis Image
Depicts a terminal window highlighting SQL code with overlay graphics of bar charts, globe icons, and waveforms, merging traditional data handling with visual analytics. Useful for illustrating concepts in data analysis, tech startups, software development, IT solutions, cybersecurity, or educational content discussing database management and security.

downloads
Tags:
More
Credit Photo
If you would like to credit the Photo, here are some ways you can do so
Text Link
photo Link
<span class="text-link">
<span>
<a target="_blank" href=https://pikwizard.com/photo/sql-coding-on-digital-interface-with-data-visualization-and-analysis/99c6f513f40cbddf255f1d3eb1b2c70b/>PikWizard</a>
</span>
</span>
<span class="image-link">
<span
style="margin: 0 0 20px 0; display: inline-block; vertical-align: middle; width: 100%;"
>
<a
target="_blank"
href="https://pikwizard.com/photo/sql-coding-on-digital-interface-with-data-visualization-and-analysis/99c6f513f40cbddf255f1d3eb1b2c70b/"
style="text-decoration: none; font-size: 10px; margin: 0;"
>
<img src="https://pikwizard.com/pw/medium/99c6f513f40cbddf255f1d3eb1b2c70b.jpg" style="margin: 0; width: 100%;" alt="" />
<p style="font-size: 12px; margin: 0;">PikWizard</p>
</a>
</span>
</span>
Free (free of charge)
Free for personal and commercial use.
Author: People Creations