- Home >
- Stock Photos >
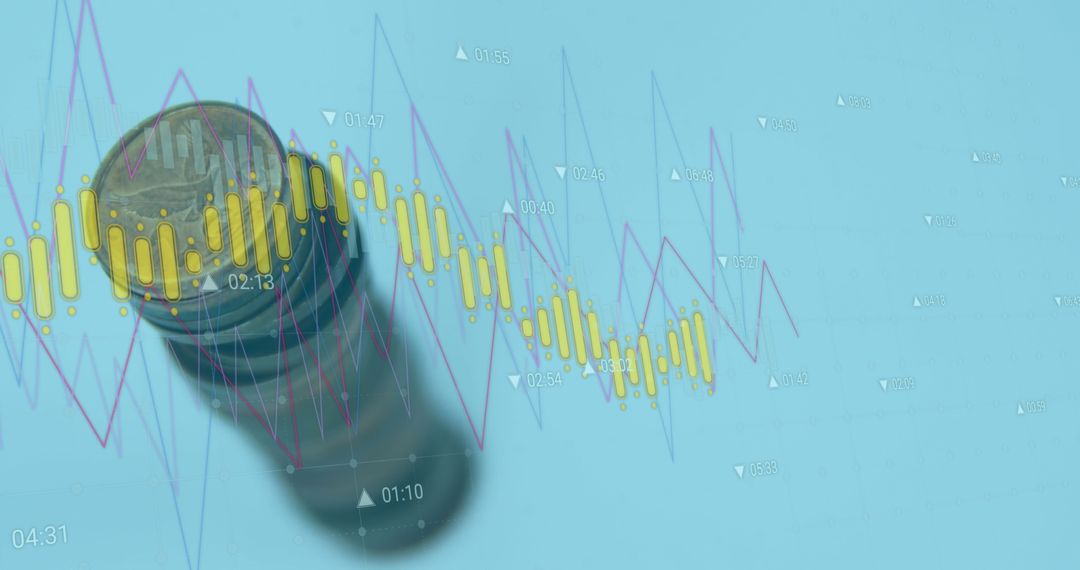
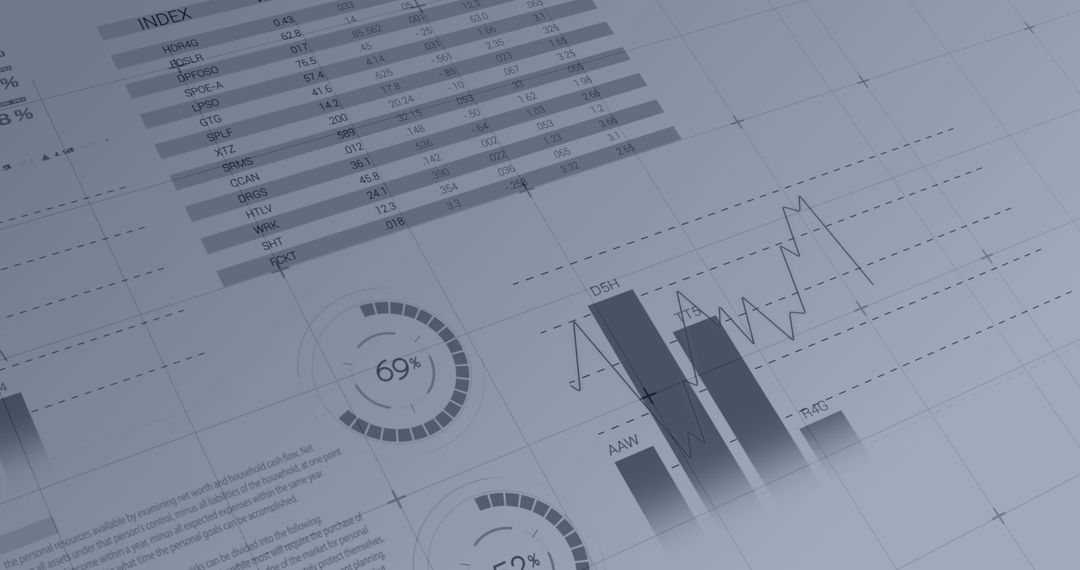
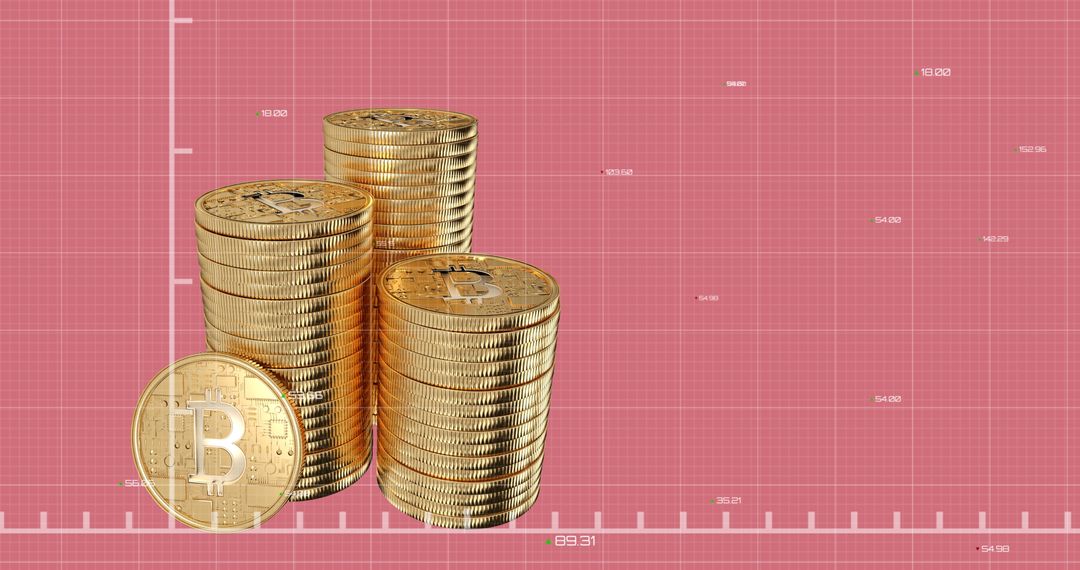
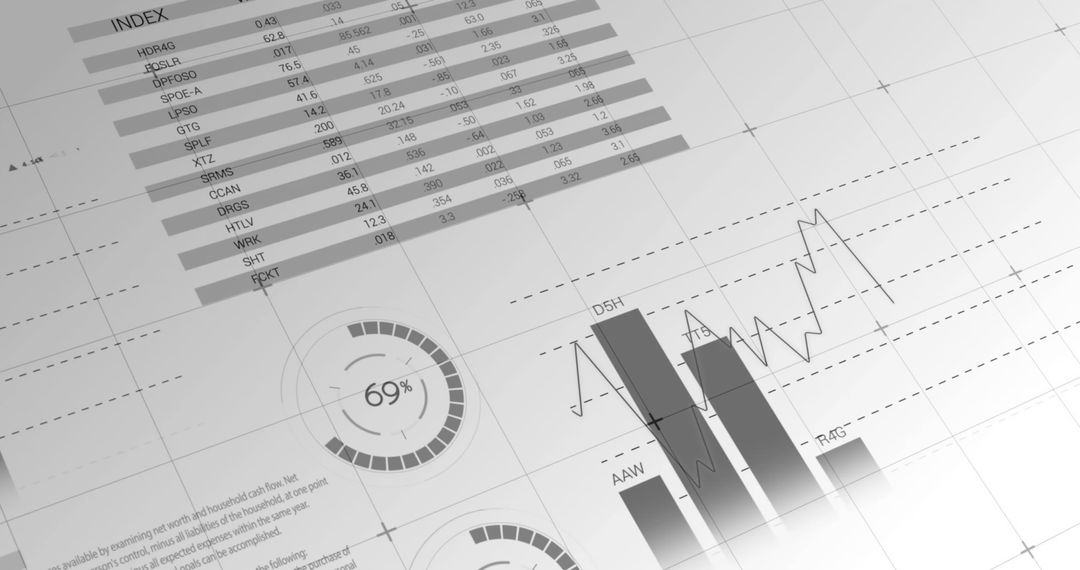
- Stack of Coins on Financial Dashboard Displaying Data
Stack of Coins on Financial Dashboard Displaying Data Image

This visual combines a stacked arrangement of coins overlaid on a digital screen showcasing various financial graphs and charts such as bar, line, and circular charts. Ideal for use in presentations or materials focused on financial investments, business analytics, economic forecasts, or digital finance technologies, effectively communicating investment strategies or intelligent decision-making concepts.
Powered by 


0
downloads
downloads
Tags:
More
Credit Photo
If you would like to credit the Photo, here are some ways you can do so
Text Link
photo Link
<span class="text-link">
<span>
<a target="_blank" href=https://pikwizard.com/photo/stack-of-coins-on-financial-dashboard-displaying-data/56cfa645187b661f23b63821f008495e/>PikWizard</a>
</span>
</span>
<span class="image-link">
<span
style="margin: 0 0 20px 0; display: inline-block; vertical-align: middle; width: 100%;"
>
<a
target="_blank"
href="https://pikwizard.com/photo/stack-of-coins-on-financial-dashboard-displaying-data/56cfa645187b661f23b63821f008495e/"
style="text-decoration: none; font-size: 10px; margin: 0;"
>
<img src="https://pikwizard.com/pw/medium/56cfa645187b661f23b63821f008495e.jpg" style="margin: 0; width: 100%;" alt="" />
<p style="font-size: 12px; margin: 0;">PikWizard</p>
</a>
</span>
</span>
Free (free of charge)
Free for personal and commercial use.
Author: Creative Art
Similar Free Stock Images

Premium


Premium


Premium


Premium


Premium


Premium


Premium


Premium


Premium


Premium


Premium


Premium


Premium


Premium


Premium


Premium


Premium


Premium


Premium


Premium


Premium


Premium


Premium


Premium