
- Home >
- Stock Photos >
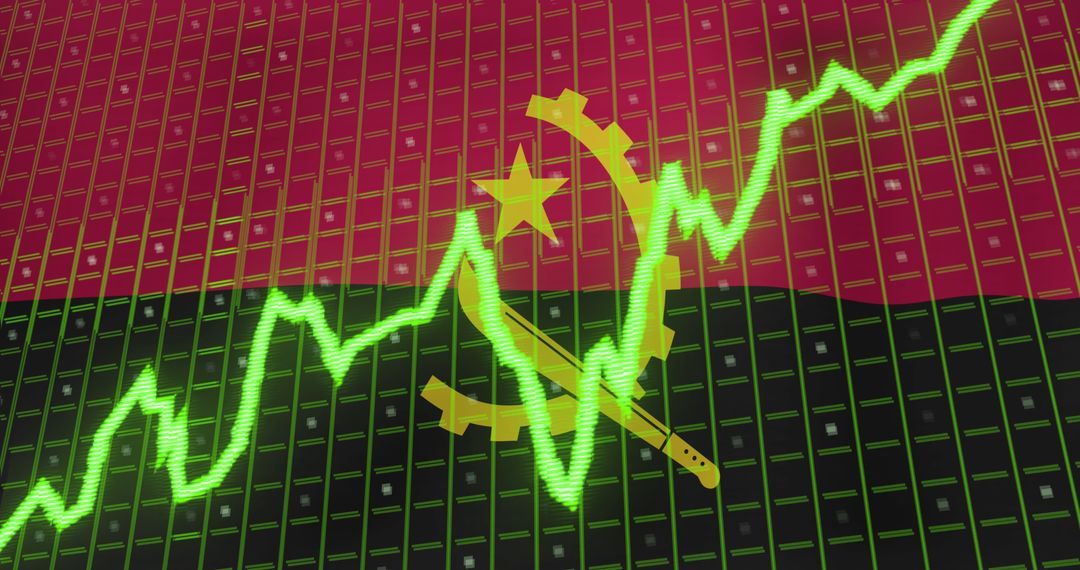
- Stagflation Concept with Digital Financial Chart and World Map
Stagflation Concept with Digital Financial Chart and World Map Image

Displaying concept of stagflation with a digital financial chart and world map overlay, this visual shows fluctuating green market lines and digital data, synonymous with economic challenges and scenarios. Ideal for use in financial reports, economic studies, presentations on global markets, and educational resources addressing macroeconomic concepts.
Powered by  - Get 15% off with code: PIKWIZARD15


2
downloads
downloads
Tags:
More
Credit Photo
If you would like to credit the Photo, here are some ways you can do so
Text Link
photo Link
<span class="text-link">
<span>
<a target="_blank" href=https://pikwizard.com/photo/stagflation-concept-with-digital-financial-chart-and-world-map/0ad9e2919aa4b9a7776d47e00ccb47da/>PikWizard</a>
</span>
</span>
<span class="image-link">
<span
style="margin: 0 0 20px 0; display: inline-block; vertical-align: middle; width: 100%;"
>
<a
target="_blank"
href="https://pikwizard.com/photo/stagflation-concept-with-digital-financial-chart-and-world-map/0ad9e2919aa4b9a7776d47e00ccb47da/"
style="text-decoration: none; font-size: 10px; margin: 0;"
>
<img src="https://pikwizard.com/pw/medium/0ad9e2919aa4b9a7776d47e00ccb47da.jpg" style="margin: 0; width: 100%;" alt="" />
<p style="font-size: 12px; margin: 0;">PikWizard</p>
</a>
</span>
</span>
Free (free of charge)
Free for personal and commercial use.
Author: Creative Art
Similar Free Stock Images

Premium


Premium


Premium


Premium


Premium


Premium


Premium


Premium


Premium


Premium


Premium


Premium


Premium


Premium


Premium


Premium


Premium


Premium


Premium


Premium


Premium


Premium


Premium


Premium

