- Home >
- Stock Photos >
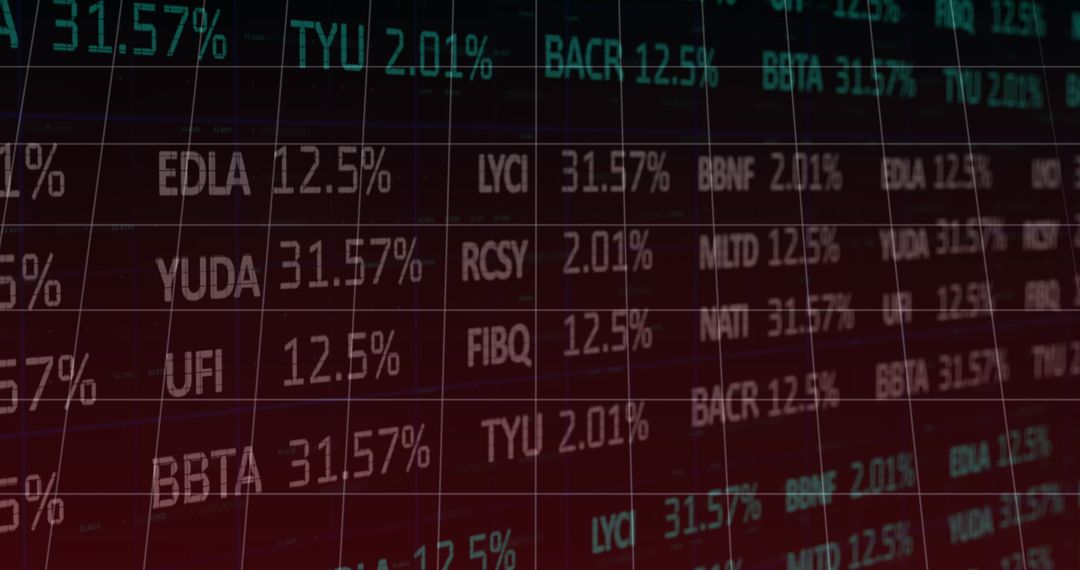
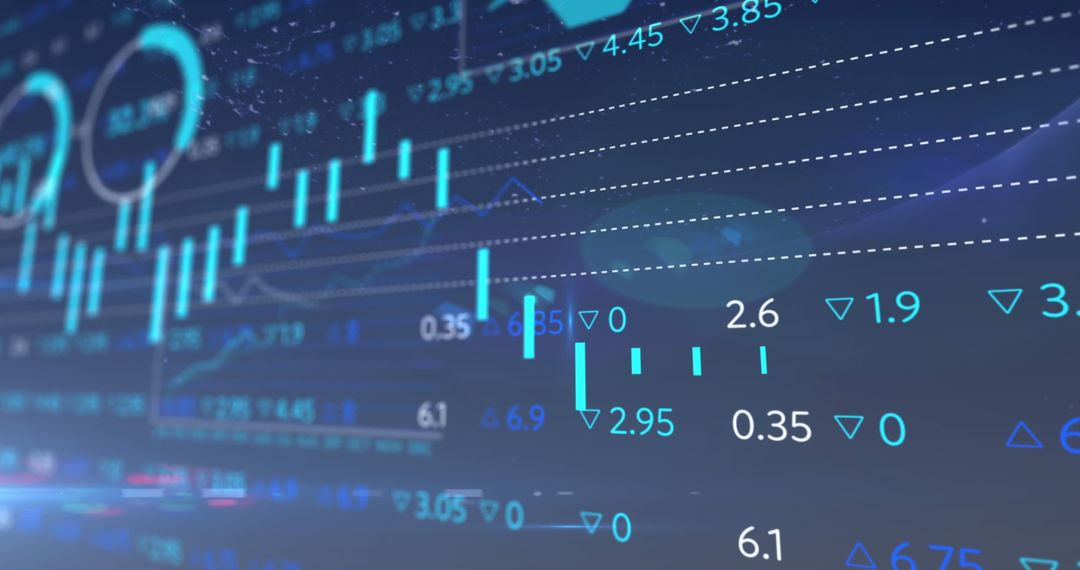
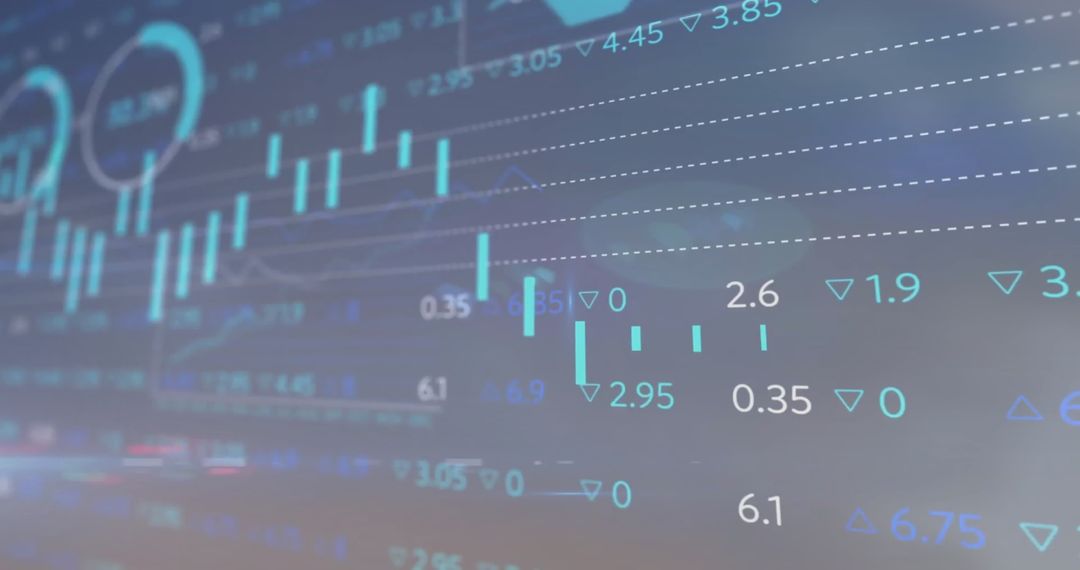
- Stagflation Concept with Digital Graphs and Data
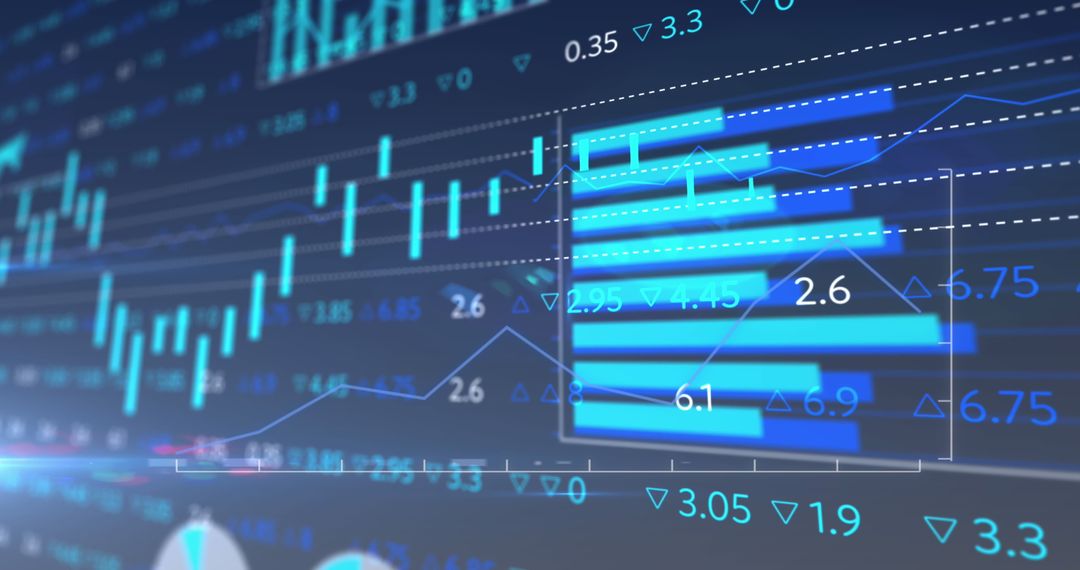
Stagflation Concept with Digital Graphs and Data Image

Stagflation text over graphs symbolizes economic stagnation and inflation. Useful for digital content discussing global financial issues, market trends, or economic studies. Ideal for financial reports, presentations, and educational resources on economic challenges.
Powered by  - Get 15% off with code: PIKWIZARD15


2
downloads
downloads
Tags:
More
Credit Photo
If you would like to credit the Photo, here are some ways you can do so
Text Link
photo Link
<span class="text-link">
<span>
<a target="_blank" href=https://pikwizard.com/photo/stagflation-concept-with-digital-graphs-and-data/a1e6043250c4132c7d1a2a46f7242a38/>PikWizard</a>
</span>
</span>
<span class="image-link">
<span
style="margin: 0 0 20px 0; display: inline-block; vertical-align: middle; width: 100%;"
>
<a
target="_blank"
href="https://pikwizard.com/photo/stagflation-concept-with-digital-graphs-and-data/a1e6043250c4132c7d1a2a46f7242a38/"
style="text-decoration: none; font-size: 10px; margin: 0;"
>
<img src="https://pikwizard.com/pw/medium/a1e6043250c4132c7d1a2a46f7242a38.jpg" style="margin: 0; width: 100%;" alt="" />
<p style="font-size: 12px; margin: 0;">PikWizard</p>
</a>
</span>
</span>
Free (free of charge)
Free for personal and commercial use.
Author: Creative Art
Similar Free Stock Images

Premium


Premium


Premium


Premium


Premium


Premium


Premium


Premium


Premium


Premium


Premium


Premium


Premium


Premium


Premium


Premium


Premium


Premium


Premium


Premium


Premium


Premium


Premium


Premium