
- Home >
- Stock Photos >
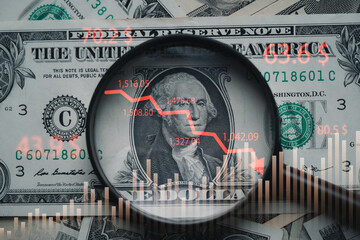
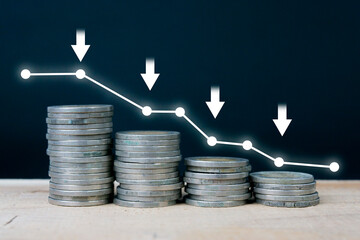
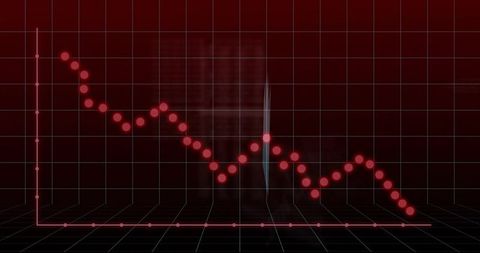
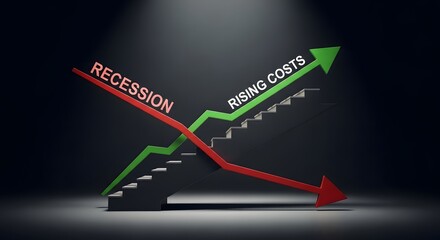
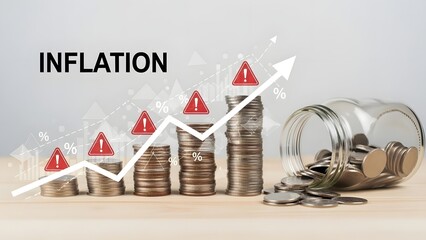
- Stagflation Concept with Graphs and Data Visualization
Stagflation Concept with Graphs and Data Visualization Image

Visual representation of stagflation combining financial graphs and digital data processing. Useful for illustrating articles and reports on economic trends, worldwide financial issues, or the impacts of inflation combined with slow economic growth. Ideal for editors and analysts dealing with business, finance, and economic reports.
Powered by 


Credit Photo
If you would like to credit the Photo, here are some ways you can do so
Text Link
photo Link
<span class="text-link">
<span>
<a target="_blank" href=https://pikwizard.com/photo/stagflation-concept-with-graphs-and-data-visualization/a48a7011d5c990e09bbd4aac2054186d/>PikWizard</a>
</span>
</span>
<span class="image-link">
<span
style="margin: 0 0 20px 0; display: inline-block; vertical-align: middle; width: 100%;"
>
<a
target="_blank"
href="https://pikwizard.com/photo/stagflation-concept-with-graphs-and-data-visualization/a48a7011d5c990e09bbd4aac2054186d/"
style="text-decoration: none; font-size: 10px; margin: 0;"
>
<img src="https://pikwizard.com/pw/medium/a48a7011d5c990e09bbd4aac2054186d.jpg" style="margin: 0; width: 100%;" alt="" />
<p style="font-size: 12px; margin: 0;">PikWizard</p>
</a>
</span>
</span>
Free (free of charge)
Free for personal and commercial use.
Author: Creative Art
Similar Free Stock Images

Premium


Premium


Premium


Premium


Premium

Premium

Premium


Premium


Premium

Premium


Premium


Premium

Premium


Premium


Premium


Premium


Premium


Premium


Premium


Premium

Premium


Premium

Premium


Premium


Premium


Explore More Free Stock Images