
- Home >
- Stock Photos >
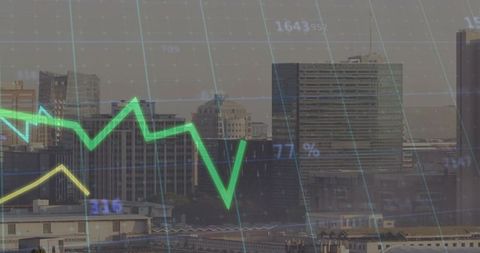
- Stagflation Displayed with Financial Data Analysis Background
Stagflation Displayed with Financial Data Analysis Background Image

Illustration shows the concept of stagflation with a digital interface featuring complex data plots in the backdrop. Useful for articles, reports, and presentations on economic conditions, financial market analysis, and economic theories.
Powered by  - Get 15% off with code: PIKWIZARD15


downloads
Tags:
More
Credit Photo
If you would like to credit the Photo, here are some ways you can do so
Text Link
photo Link
<span class="text-link">
<span>
<a target="_blank" href=https://pikwizard.com/photo/stagflation-displayed-with-financial-data-analysis-background/1e47be00a96e64d9e960810fb10ebbad/>PikWizard</a>
</span>
</span>
<span class="image-link">
<span
style="margin: 0 0 20px 0; display: inline-block; vertical-align: middle; width: 100%;"
>
<a
target="_blank"
href="https://pikwizard.com/photo/stagflation-displayed-with-financial-data-analysis-background/1e47be00a96e64d9e960810fb10ebbad/"
style="text-decoration: none; font-size: 10px; margin: 0;"
>
<img src="https://pikwizard.com/pw/medium/1e47be00a96e64d9e960810fb10ebbad.jpg" style="margin: 0; width: 100%;" alt="" />
<p style="font-size: 12px; margin: 0;">PikWizard</p>
</a>
</span>
</span>
Free (free of charge)
Free for personal and commercial use.
Author: Awesome Content
Similar Free Stock Images

Premium


Premium
Premium


Premium


Premium


Premium


Premium

Premium

Premium


Premium

Premium


Premium


Premium


Premium


Premium


Premium


Premium


Premium

Premium


Premium


Premium


Premium

Premium


Premium

Premium


Explore More Free Stock Images