
- Home >
- Stock Photos >
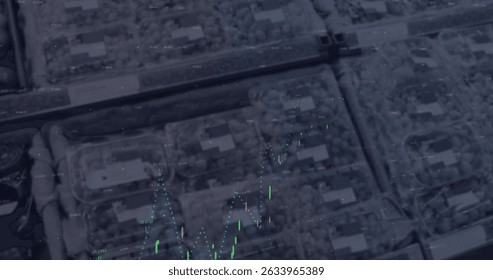
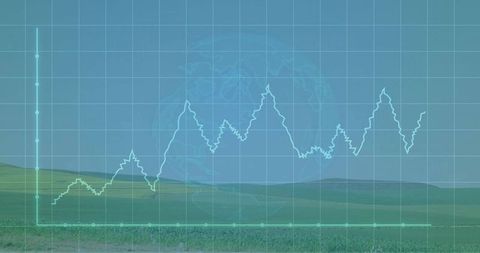
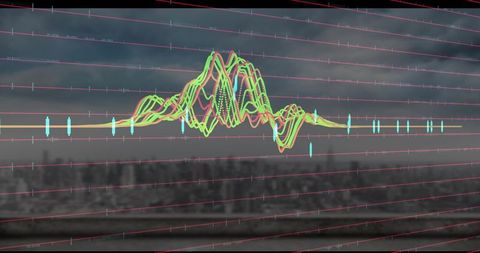
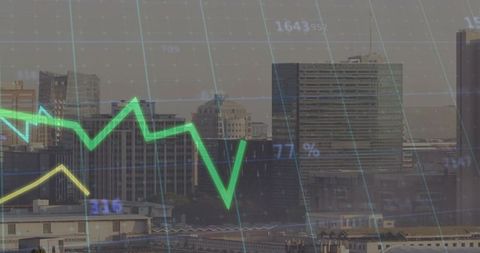
- Statistical Data Analysis over Urban Cityscape Background
Statistical Data Analysis over Urban Cityscape Background Image

This abstract representation of statistical data processing set against an aerial view of a cityscape is perfect for illustrating themes of business technology, digital data analysis, and urban economics. Ideal for use in presentations, reports, or websites focused on data science, smart city initiatives, or future urban developments.
Powered by  - Get 15% off with code: PIKWIZARD15


downloads
Tags:
More
Credit Photo
If you would like to credit the Photo, here are some ways you can do so
Text Link
photo Link
<span class="text-link">
<span>
<a target="_blank" href=https://pikwizard.com/photo/statistical-data-analysis-over-urban-cityscape-background/9864f0208d8e34df4b5c251705f8f886/>PikWizard</a>
</span>
</span>
<span class="image-link">
<span
style="margin: 0 0 20px 0; display: inline-block; vertical-align: middle; width: 100%;"
>
<a
target="_blank"
href="https://pikwizard.com/photo/statistical-data-analysis-over-urban-cityscape-background/9864f0208d8e34df4b5c251705f8f886/"
style="text-decoration: none; font-size: 10px; margin: 0;"
>
<img src="https://pikwizard.com/pw/medium/9864f0208d8e34df4b5c251705f8f886.jpg" style="margin: 0; width: 100%;" alt="" />
<p style="font-size: 12px; margin: 0;">PikWizard</p>
</a>
</span>
</span>
Free (free of charge)
Free for personal and commercial use.
Author: People Creations
Similar Free Stock Images

Premium


Premium

Premium


Premium


Premium


Premium


Premium


Premium

Premium

Premium
Premium


Premium


Premium


Premium


Premium


Premium


Premium


Premium


Premium


Premium


Premium


Premium


Premium


Premium


Premium


Explore More Free Stock Images