
- Home >
- Stock Photos >
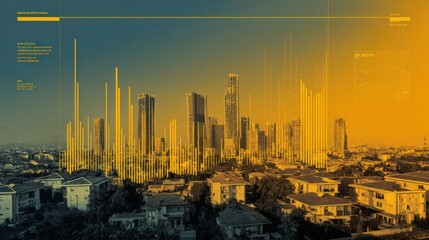
- Statistical Data Analysis Overlay on Urban Skyscraper Background
Statistical Data Analysis Overlay on Urban Skyscraper Background Image

Visual blending of statistical charts with urban architecture signifies the integration of data analytics in business environments. Suitable for finance, technology, and business presentations, highlighting the modern approach to data-driven decision-making.
Powered by 


downloads
Tags:
More
Credit Photo
If you would like to credit the Photo, here are some ways you can do so
Text Link
photo Link
<span class="text-link">
<span>
<a target="_blank" href=https://pikwizard.com/photo/statistical-data-analysis-overlay-on-urban-skyscraper-background/8896cfba4797bb4dbf82ce5d7d7761a4/>PikWizard</a>
</span>
</span>
<span class="image-link">
<span
style="margin: 0 0 20px 0; display: inline-block; vertical-align: middle; width: 100%;"
>
<a
target="_blank"
href="https://pikwizard.com/photo/statistical-data-analysis-overlay-on-urban-skyscraper-background/8896cfba4797bb4dbf82ce5d7d7761a4/"
style="text-decoration: none; font-size: 10px; margin: 0;"
>
<img src="https://pikwizard.com/pw/medium/8896cfba4797bb4dbf82ce5d7d7761a4.jpg" style="margin: 0; width: 100%;" alt="" />
<p style="font-size: 12px; margin: 0;">PikWizard</p>
</a>
</span>
</span>
Free (free of charge)
Free for personal and commercial use.
Author: Authentic Images
Similar Free Stock Images

Premium


Premium


Premium


Premium


Premium


Premium

Premium


Premium

Premium


Premium


Premium

Premium


Premium

Premium


Premium


Premium


Premium

Premium

Premium


Premium


Premium

Premium


Premium

Premium


Premium
Explore More Free Stock Images