
- Home >
- Stock Photos >
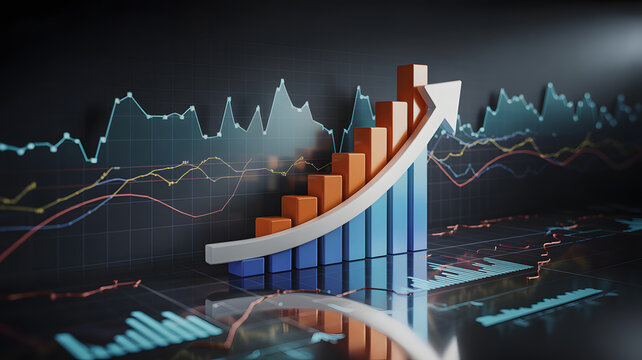
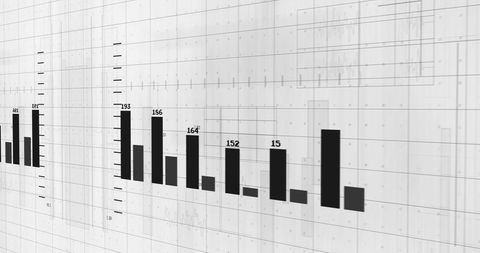
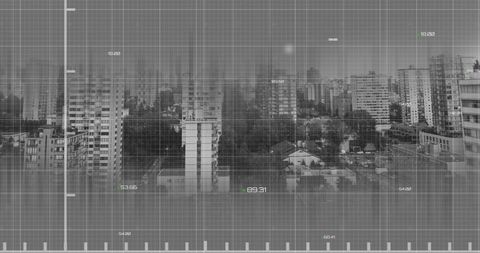
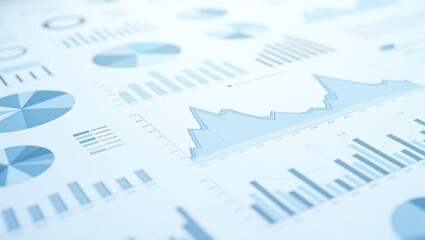
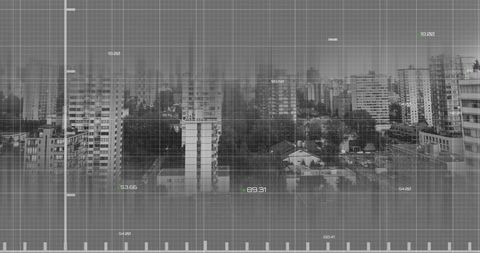
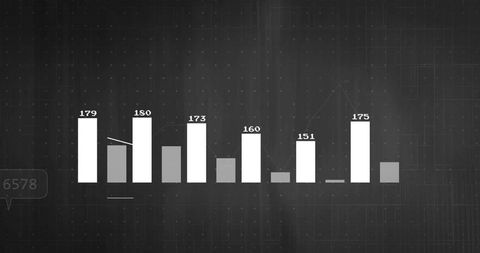
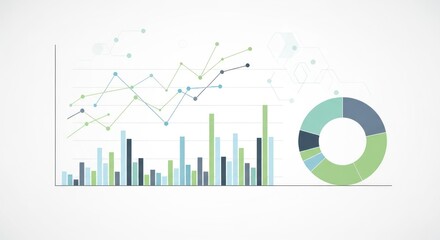
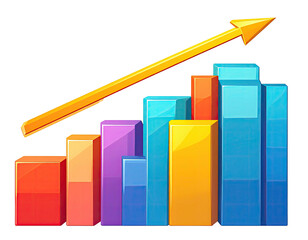
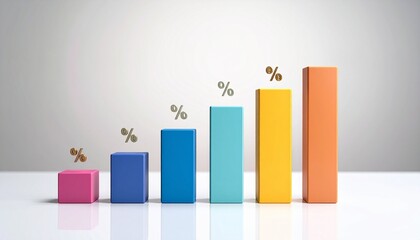
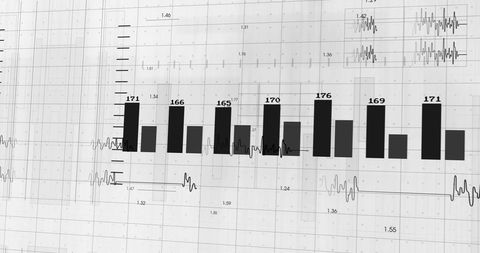
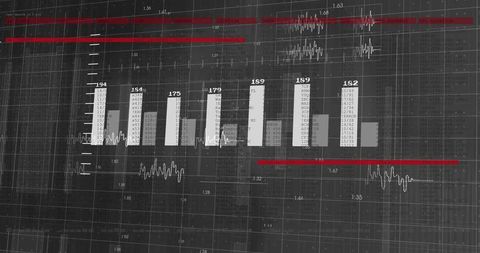
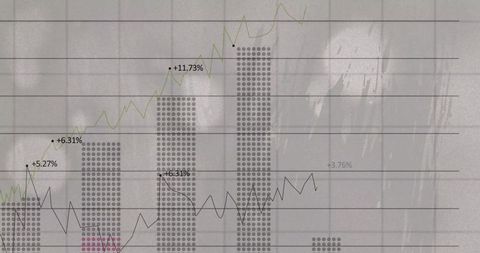
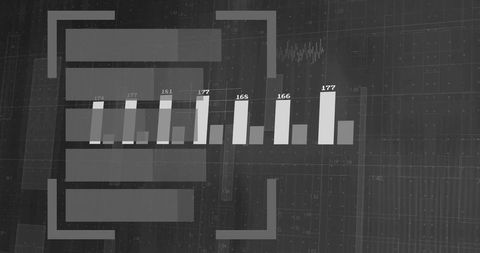
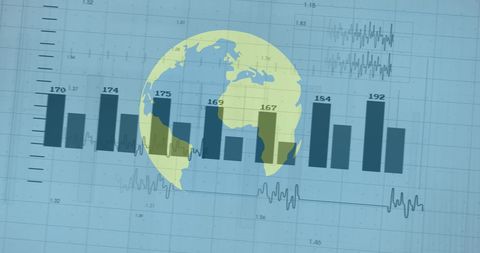
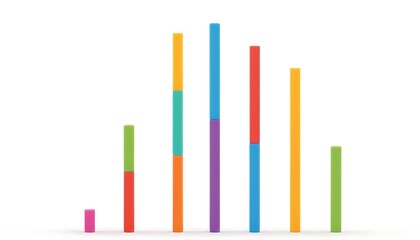
- Statistical Data Analysis with Bar Charts and Graphs
Statistical Data Analysis with Bar Charts and Graphs Image

Visual depicting various statistical elements commonly used in business or academic data analysis. Handy for presentations on financial performance, economic studies, scientific research, or instructional materials on data visualization. Effective in illustrating complex datasets and offering insights into increasing or decreasing trends over time.
Powered by 


downloads
Tags:
More
Credit Photo
If you would like to credit the Photo, here are some ways you can do so
Text Link
photo Link
<span class="text-link">
<span>
<a target="_blank" href=https://pikwizard.com/photo/statistical-data-analysis-with-bar-charts-and-graphs/2f812e2be982e743bfb19d955b8de174/>PikWizard</a>
</span>
</span>
<span class="image-link">
<span
style="margin: 0 0 20px 0; display: inline-block; vertical-align: middle; width: 100%;"
>
<a
target="_blank"
href="https://pikwizard.com/photo/statistical-data-analysis-with-bar-charts-and-graphs/2f812e2be982e743bfb19d955b8de174/"
style="text-decoration: none; font-size: 10px; margin: 0;"
>
<img src="https://pikwizard.com/pw/medium/2f812e2be982e743bfb19d955b8de174.jpg" style="margin: 0; width: 100%;" alt="" />
<p style="font-size: 12px; margin: 0;">PikWizard</p>
</a>
</span>
</span>
Free (free of charge)
Free for personal and commercial use.
Author: Awesome Content
Similar Free Stock Images

Premium

Premium


Premium


Premium


Premium


Premium


Premium

Premium


Premium


Premium

Premium


Premium


Premium
Premium


Premium


Premium


Premium


Premium


Premium


Premium


Premium


Premium


Premium


Premium

Premium

Explore More Free Stock Images