- Home >
- Stock Photos >
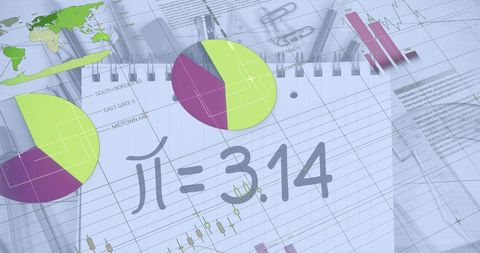
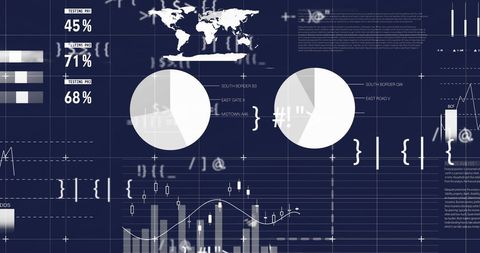
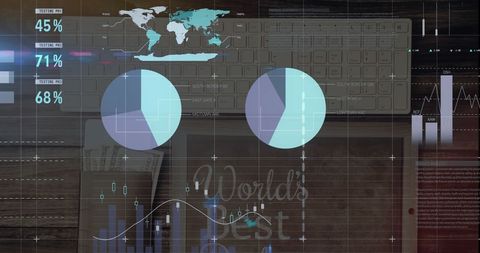
- Statistical Data Analysis with Mathematical Equations and Charts
Statistical Data Analysis with Mathematical Equations and Charts Image

Perfect for illustrating concepts in data science, education, and technology industries. Can be used in brochures, digital presentations, or articles to depict modern analytical methods and showcase technical research skills. The visually futuristic elements make it ideal for tech-focused marketing materials.

downloads
Tags:
More
Credit Photo
If you would like to credit the Photo, here are some ways you can do so
Text Link
photo Link
<span class="text-link">
<span>
<a target="_blank" href=https://pikwizard.com/photo/statistical-data-analysis-with-mathematical-equations-and-charts/4b047971837944f44e905ad5ff43cda9/>PikWizard</a>
</span>
</span>
<span class="image-link">
<span
style="margin: 0 0 20px 0; display: inline-block; vertical-align: middle; width: 100%;"
>
<a
target="_blank"
href="https://pikwizard.com/photo/statistical-data-analysis-with-mathematical-equations-and-charts/4b047971837944f44e905ad5ff43cda9/"
style="text-decoration: none; font-size: 10px; margin: 0;"
>
<img src="https://pikwizard.com/pw/medium/4b047971837944f44e905ad5ff43cda9.jpg" style="margin: 0; width: 100%;" alt="" />
<p style="font-size: 12px; margin: 0;">PikWizard</p>
</a>
</span>
</span>
Free (free of charge)
Free for personal and commercial use.
Author: Authentic Images