
- Home >
- Stock Photos >
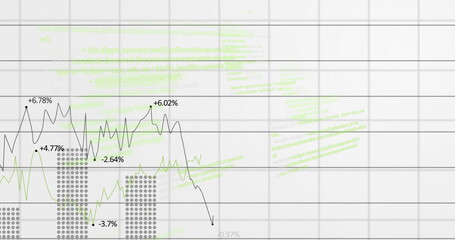
- Statistical Data and Trends Over Digital Grid Overlay
Statistical Data and Trends Over Digital Grid Overlay Image

Visualization featuring statistical data processing superimposed on a digital grid and gradient background. Useful for illustrating global economic trends, market analyses, and technological advancements in business. Ideal for presentations, educational materials, or reports involving financial data or economic strategy.
Powered by 


downloads
Tags:
More
Credit Photo
If you would like to credit the Photo, here are some ways you can do so
Text Link
photo Link
<span class="text-link">
<span>
<a target="_blank" href=https://pikwizard.com/photo/statistical-data-and-trends-over-digital-grid-overlay/855f139997a6ad4eec8ce29631e9d556/>PikWizard</a>
</span>
</span>
<span class="image-link">
<span
style="margin: 0 0 20px 0; display: inline-block; vertical-align: middle; width: 100%;"
>
<a
target="_blank"
href="https://pikwizard.com/photo/statistical-data-and-trends-over-digital-grid-overlay/855f139997a6ad4eec8ce29631e9d556/"
style="text-decoration: none; font-size: 10px; margin: 0;"
>
<img src="https://pikwizard.com/pw/medium/855f139997a6ad4eec8ce29631e9d556.jpg" style="margin: 0; width: 100%;" alt="" />
<p style="font-size: 12px; margin: 0;">PikWizard</p>
</a>
</span>
</span>
Free (free of charge)
Free for personal and commercial use.
Author: Creative Art
Similar Free Stock Images

Premium


Premium


Premium


Premium


Premium


Premium


Premium


Premium


Premium


Premium


Premium


Premium


Premium


Premium


Premium


Premium


Premium

Premium


Premium


Premium


Premium


Premium


Explore More Free Stock Images