
- Home >
- Stock Photos >
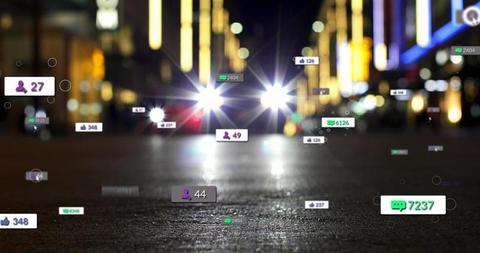
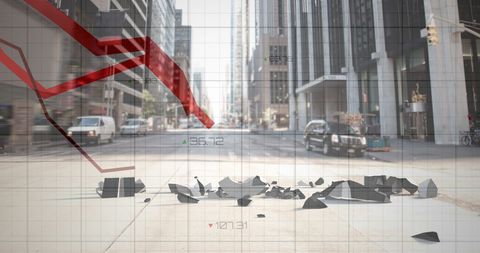
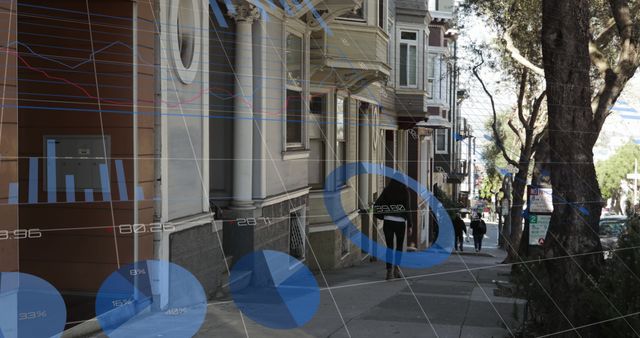
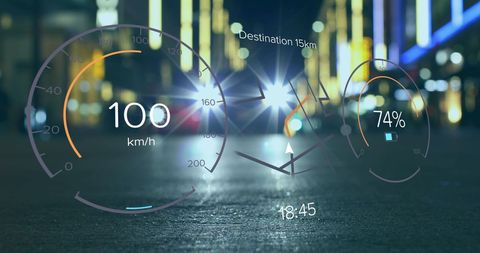
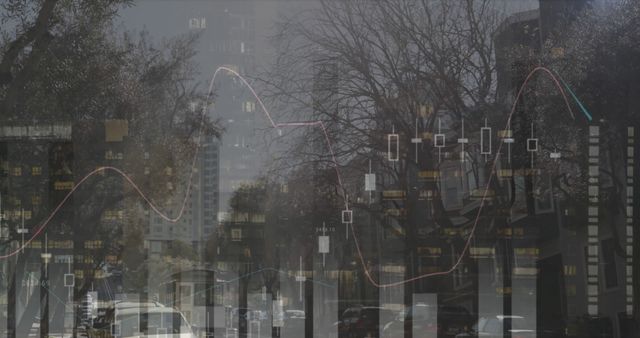
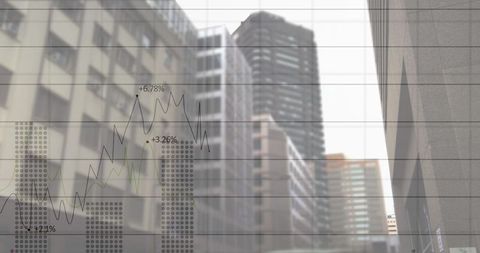
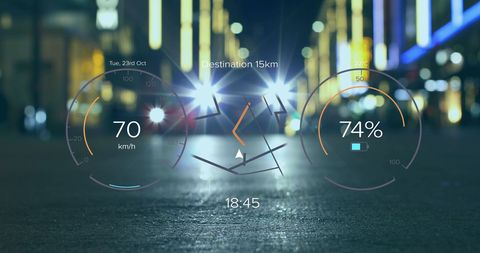
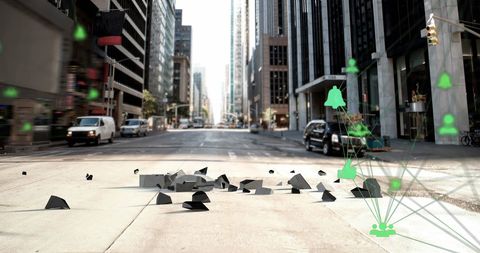
- Statistical Data Processing Overlay on Busy City Street
Statistical Data Processing Overlay on Busy City Street Image
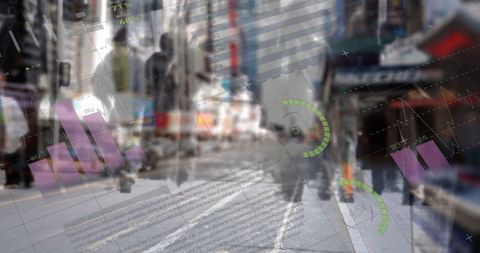
Visual representation blends statistical graphs with urban environment, exploring concept of modern technology embedded in daily life. Useful for illustrating data-driven future, city technology advances, business analysis themes.
Powered by  - Get 15% off with code: PIKWIZARD15


downloads
Tags:
More
Credit Photo
If you would like to credit the Photo, here are some ways you can do so
Text Link
photo Link
<span class="text-link">
<span>
<a target="_blank" href=https://pikwizard.com/photo/statistical-data-processing-overlay-on-busy-city-street/7228af8bdb7a519034f5dc2d7c1890a4/>PikWizard</a>
</span>
</span>
<span class="image-link">
<span
style="margin: 0 0 20px 0; display: inline-block; vertical-align: middle; width: 100%;"
>
<a
target="_blank"
href="https://pikwizard.com/photo/statistical-data-processing-overlay-on-busy-city-street/7228af8bdb7a519034f5dc2d7c1890a4/"
style="text-decoration: none; font-size: 10px; margin: 0;"
>
<img src="https://pikwizard.com/pw/medium/7228af8bdb7a519034f5dc2d7c1890a4.jpg" style="margin: 0; width: 100%;" alt="" />
<p style="font-size: 12px; margin: 0;">PikWizard</p>
</a>
</span>
</span>
Free (free of charge)
Free for personal and commercial use.
Author: Authentic Images
Similar Free Stock Images

Premium


Premium

Premium

Premium


Premium

Premium


Premium


Premium


Premium

Premium


Premium

Premium


Premium


Premium


Premium


Premium


Premium


Premium

Premium


Premium


Premium


Premium


Premium


Premium

Premium

Explore More Free Stock Images