
- Home >
- Stock Photos >
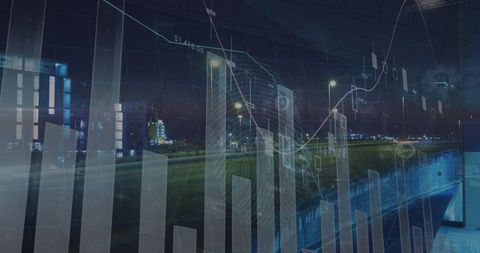
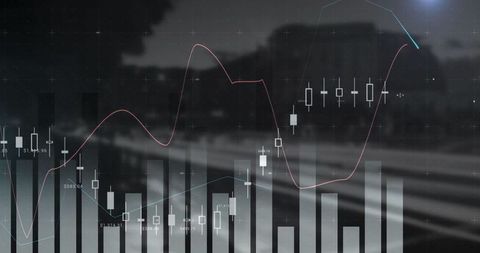
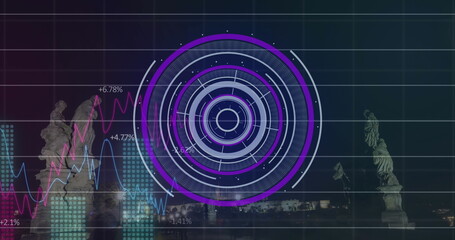
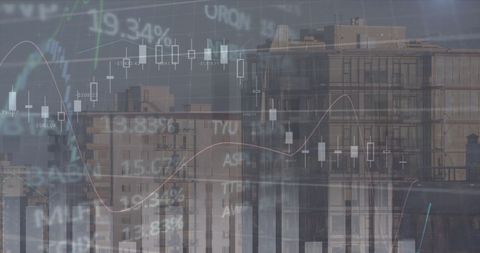
- Statistical Data Processing with Night City Background
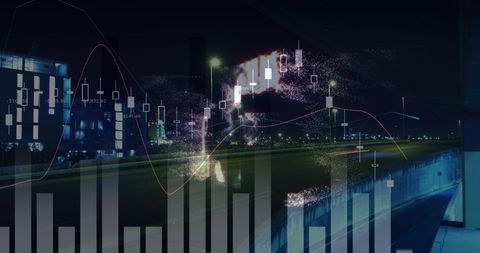
Statistical Data Processing with Night City Background Image

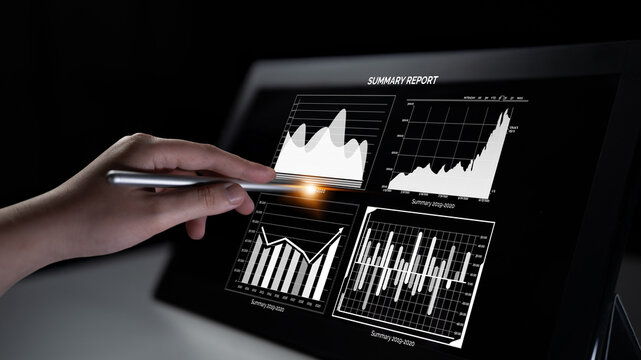
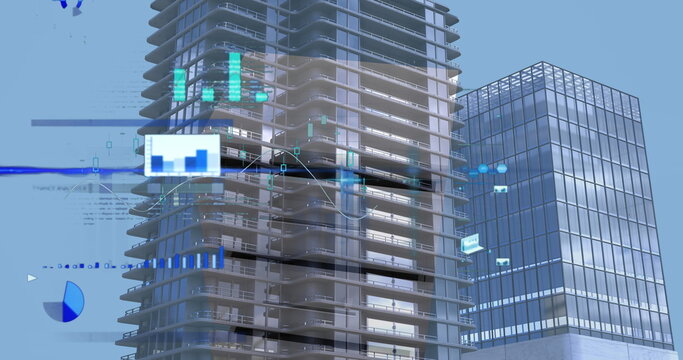
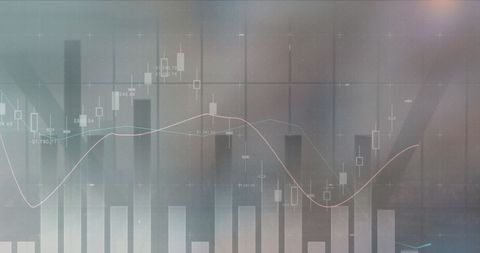
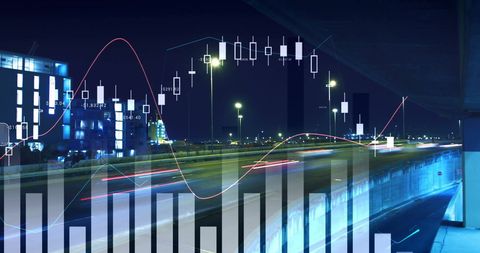
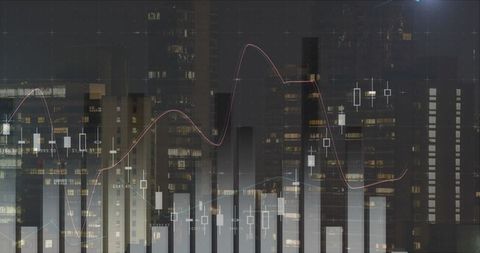
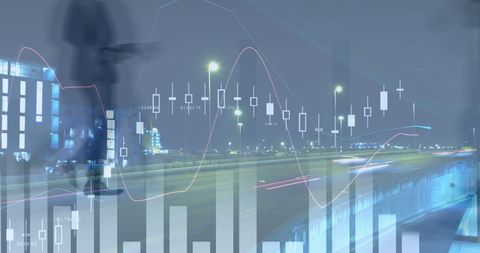
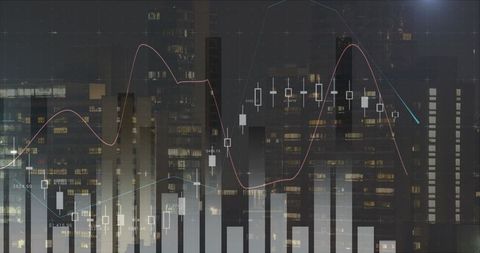
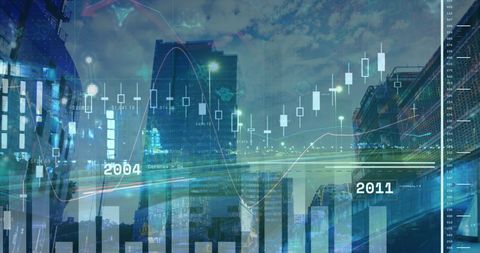
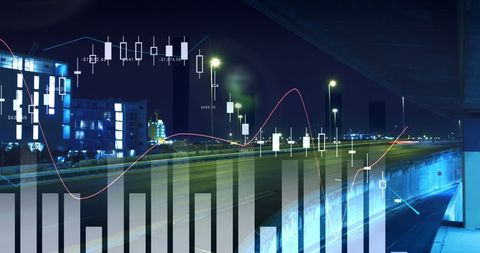
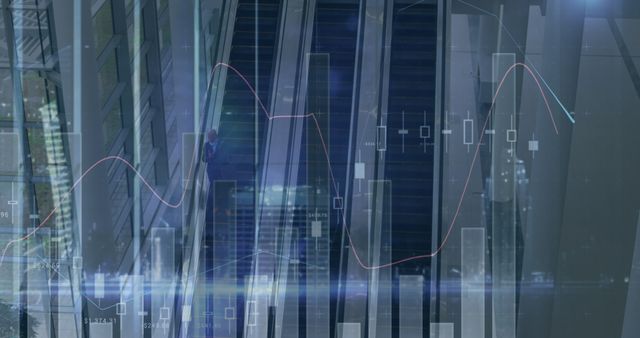
Intricate blending of statistical data processing graphics with underlying cityscape highlights themes of technology and urban business activity. Suitable for illustrating global business trends, economic analysis, or financial forecasting concepts. Also useful for marketing materials or presentations related to finance, urban planning, or technological advancement.
Powered by 


downloads
Tags:
More
Credit Photo
If you would like to credit the Photo, here are some ways you can do so
Text Link
photo Link
<span class="text-link">
<span>
<a target="_blank" href=https://pikwizard.com/photo/statistical-data-processing-with-night-city-background/4b2479687c2cbe0d777ef3a62adac063/>PikWizard</a>
</span>
</span>
<span class="image-link">
<span
style="margin: 0 0 20px 0; display: inline-block; vertical-align: middle; width: 100%;"
>
<a
target="_blank"
href="https://pikwizard.com/photo/statistical-data-processing-with-night-city-background/4b2479687c2cbe0d777ef3a62adac063/"
style="text-decoration: none; font-size: 10px; margin: 0;"
>
<img src="https://pikwizard.com/pw/medium/4b2479687c2cbe0d777ef3a62adac063.jpg" style="margin: 0; width: 100%;" alt="" />
<p style="font-size: 12px; margin: 0;">PikWizard</p>
</a>
</span>
</span>
Free (free of charge)
Free for personal and commercial use.
Author: Awesome Content
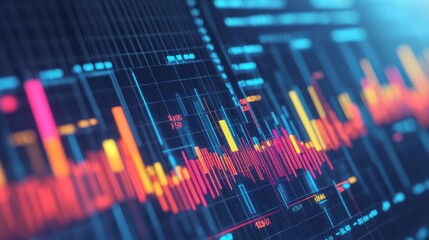
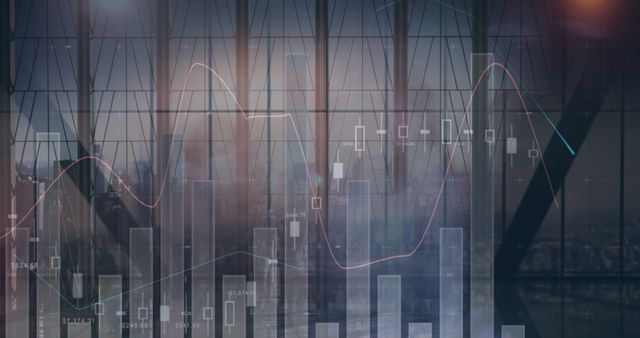
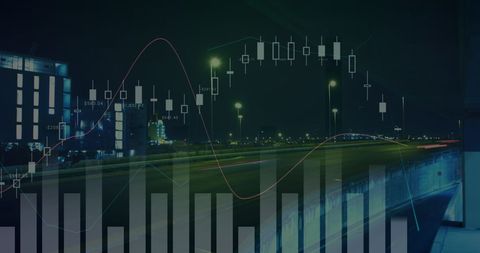
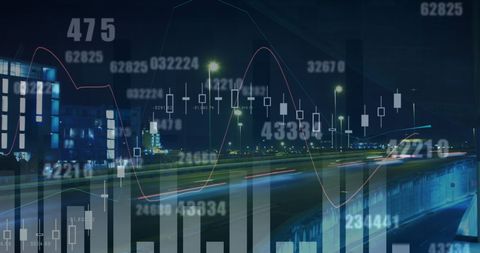
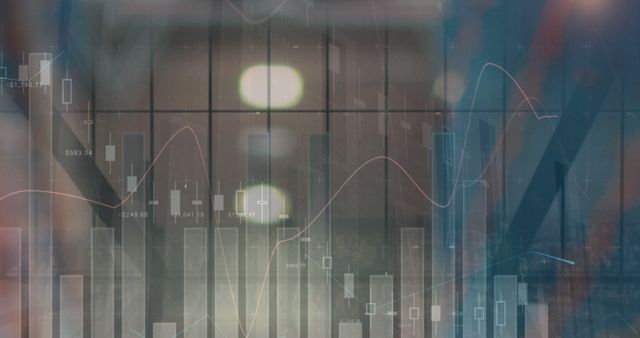
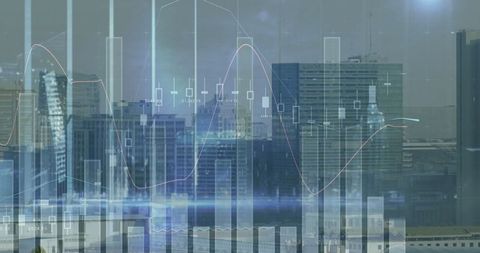
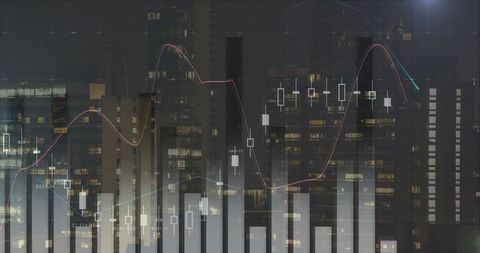
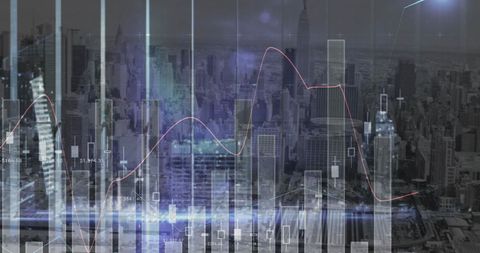
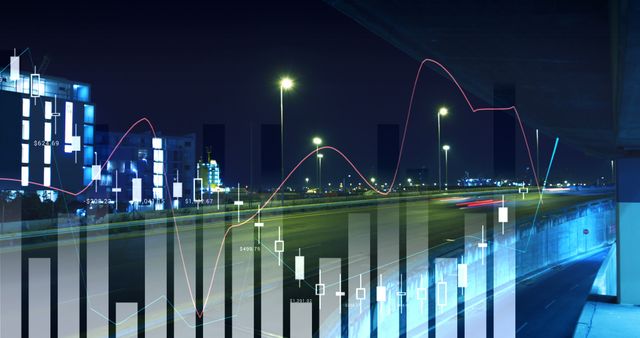
Similar Free Stock Images

Premium


Premium


Premium


Premium

Premium


Premium

Premium


Premium


Premium


Premium


Premium

Premium


Premium

Premium

Premium


Premium


Premium


Premium


Premium

Premium


Premium


Premium


Premium

Premium


Premium


Explore More Free Stock Images