
- Home >
- Stock Photos >
- Statistical Data Visualization and Digital Technology Setup
Statistical Data Visualization and Digital Technology Setup Image
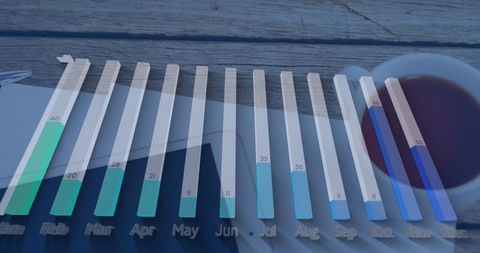
Image combines a digital interface displaying bar graphs with a close-up view of a workspace including a digital tablet and coffee cup. Suitable for illustrating modern business analytics, financial report preparation, or a technology-driven office environment concept.

downloads
Tags:
More
Credit Photo
If you would like to credit the Photo, here are some ways you can do so
Text Link
photo Link
<span class="text-link">
<span>
<a target="_blank" href=https://pikwizard.com/photo/statistical-data-visualization-and-digital-technology-setup/6ce15fde04497a5847c530e889bea342/>PikWizard</a>
</span>
</span>
<span class="image-link">
<span
style="margin: 0 0 20px 0; display: inline-block; vertical-align: middle; width: 100%;"
>
<a
target="_blank"
href="https://pikwizard.com/photo/statistical-data-visualization-and-digital-technology-setup/6ce15fde04497a5847c530e889bea342/"
style="text-decoration: none; font-size: 10px; margin: 0;"
>
<img src="https://pikwizard.com/pw/medium/6ce15fde04497a5847c530e889bea342.jpg" style="margin: 0; width: 100%;" alt="" />
<p style="font-size: 12px; margin: 0;">PikWizard</p>
</a>
</span>
</span>
Free (free of charge)
Free for personal and commercial use.
Author: People Creations