- Home >
- Stock Photos >
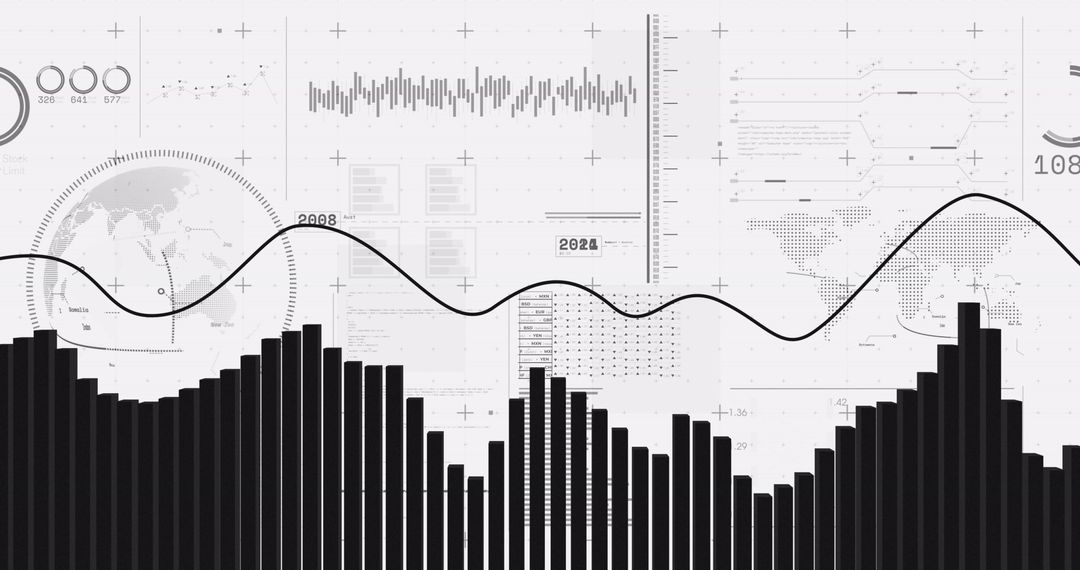
- Statistical Graph Overlay with Pencil on Blue Background
Statistical Graph Overlay with Pencil on Blue Background Image

Graph visualized over pencil reference suggesting analysis and learning context, suitable for illustrating educational publications, data analysis guides, or financial reports emphasizing study and interpretation of statistical information.
Powered by 


2
downloads
downloads
Tags:
More
Credit Photo
If you would like to credit the Photo, here are some ways you can do so
Text Link
photo Link
<span class="text-link">
<span>
<a target="_blank" href=https://pikwizard.com/photo/statistical-graph-overlay-with-pencil-on-blue-background/7b768b1152ebae0492f11c88d598f5df/>PikWizard</a>
</span>
</span>
<span class="image-link">
<span
style="margin: 0 0 20px 0; display: inline-block; vertical-align: middle; width: 100%;"
>
<a
target="_blank"
href="https://pikwizard.com/photo/statistical-graph-overlay-with-pencil-on-blue-background/7b768b1152ebae0492f11c88d598f5df/"
style="text-decoration: none; font-size: 10px; margin: 0;"
>
<img src="https://pikwizard.com/pw/medium/7b768b1152ebae0492f11c88d598f5df.jpg" style="margin: 0; width: 100%;" alt="" />
<p style="font-size: 12px; margin: 0;">PikWizard</p>
</a>
</span>
</span>
Free (free of charge)
Free for personal and commercial use.
Author: Authentic Images
Similar Free Stock Images

Premium


Premium


Premium


Premium


Premium


Premium


Premium


Premium


Premium


Premium


Premium


Premium


Premium


Premium


Premium


Premium


Premium


Premium


Premium


Premium


Premium


Premium


Premium


Premium