- Home >
- Stock Photos >
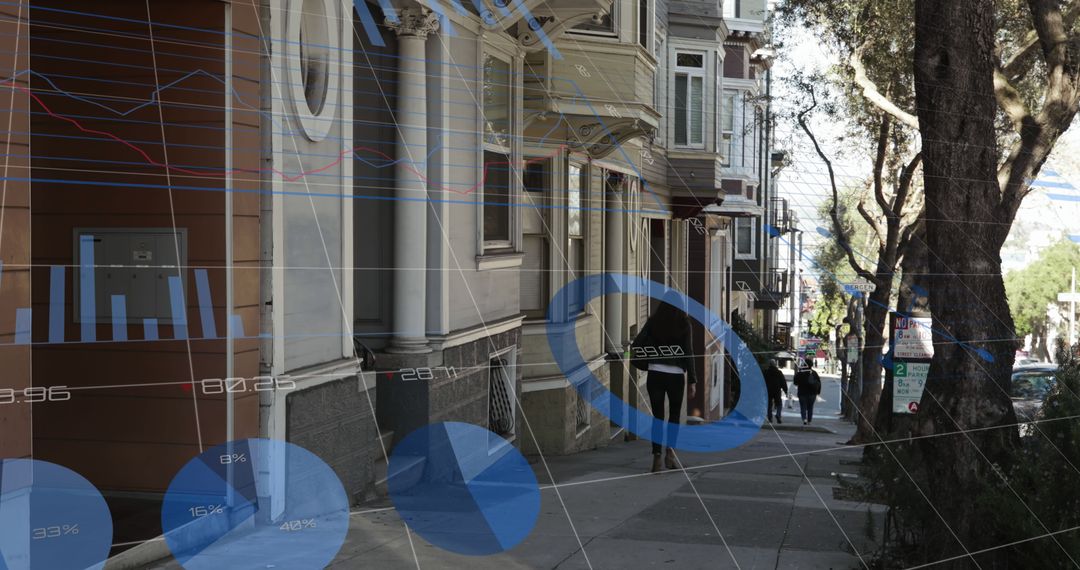
- Statistical Pie Charts Overlay on Urban Street Scene
Statistical Pie Charts Overlay on Urban Street Scene Image

Image shows the melding of statistical data visualization with a bustling city street, reflecting the intersection of business technology and urban life. Useful for projects focusing on data analytics, modern business solutions, urban studies, and technology integration in daily life.
Powered by 


2
downloads
downloads
Tags:
More
Credit Photo
If you would like to credit the Photo, here are some ways you can do so
Text Link
photo Link
<span class="text-link">
<span>
<a target="_blank" href=https://pikwizard.com/photo/statistical-pie-charts-overlay-on-urban-street-scene/cc1a2500c48f97c7bb6232722fa7ccba/>PikWizard</a>
</span>
</span>
<span class="image-link">
<span
style="margin: 0 0 20px 0; display: inline-block; vertical-align: middle; width: 100%;"
>
<a
target="_blank"
href="https://pikwizard.com/photo/statistical-pie-charts-overlay-on-urban-street-scene/cc1a2500c48f97c7bb6232722fa7ccba/"
style="text-decoration: none; font-size: 10px; margin: 0;"
>
<img src="https://pikwizard.com/pw/medium/cc1a2500c48f97c7bb6232722fa7ccba.jpg" style="margin: 0; width: 100%;" alt="" />
<p style="font-size: 12px; margin: 0;">PikWizard</p>
</a>
</span>
</span>
Free (free of charge)
Free for personal and commercial use.
Author: Awesome Content
Similar Free Stock Images

Premium


Premium


Premium


Premium


Premium


Premium


Premium


Premium


Premium


Premium


Premium


Premium


Premium


Premium


Premium


Premium


Premium


Premium


Premium


Premium


Premium


Premium


Premium


Premium