- Home >
- Stock Photos >
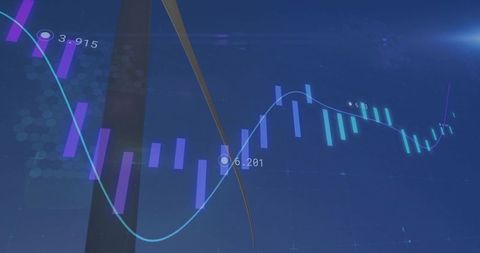
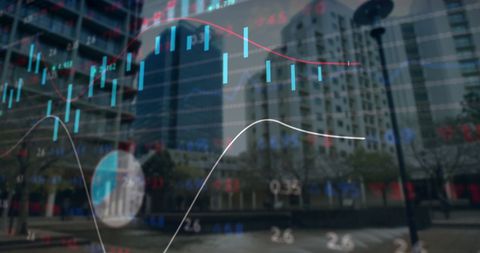
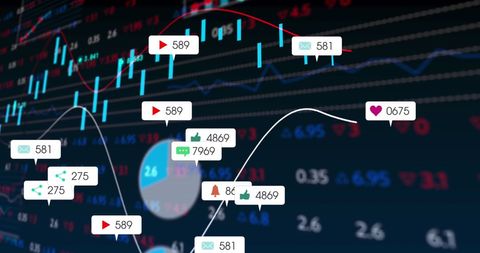
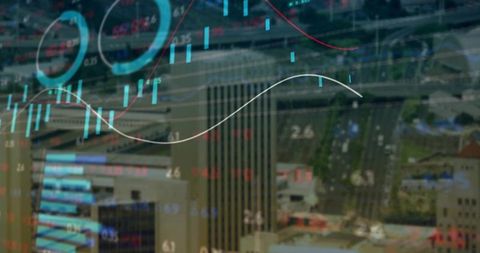
- Statistical Stock Market Data with Night City Traffic Overlay
Statistical Stock Market Data with Night City Traffic Overlay Image

View capturing technological and financial influx in urban night setting, depicting floating stock graphs superimposed on city traffic lights. Effective for representing concepts of global economy, technological advancement, big data analysis, or educational purposes about finance and business adaptability.
Powered by 


downloads
Tags:
More
Credit Photo
If you would like to credit the Photo, here are some ways you can do so
Text Link
photo Link
<span class="text-link">
<span>
<a target="_blank" href=https://pikwizard.com/photo/statistical-stock-market-data-with-night-city-traffic-overlay/d591a05a337e09717aa09b4e781c6f30/>PikWizard</a>
</span>
</span>
<span class="image-link">
<span
style="margin: 0 0 20px 0; display: inline-block; vertical-align: middle; width: 100%;"
>
<a
target="_blank"
href="https://pikwizard.com/photo/statistical-stock-market-data-with-night-city-traffic-overlay/d591a05a337e09717aa09b4e781c6f30/"
style="text-decoration: none; font-size: 10px; margin: 0;"
>
<img src="https://pikwizard.com/pw/medium/d591a05a337e09717aa09b4e781c6f30.jpg" style="margin: 0; width: 100%;" alt="" />
<p style="font-size: 12px; margin: 0;">PikWizard</p>
</a>
</span>
</span>
Free (free of charge)
Free for personal and commercial use.
Author: Awesome Content
Similar Free Stock Images
Loading...

Premium


Premium


Premium


Premium


Premium


Premium

Premium

Premium


Premium


Premium

Premium


Premium


Premium


Premium

Premium

Premium


Premium


Premium


Premium


Premium


Premium

Premium


Premium


Premium


Premium