
- Home >
- Stock Photos >
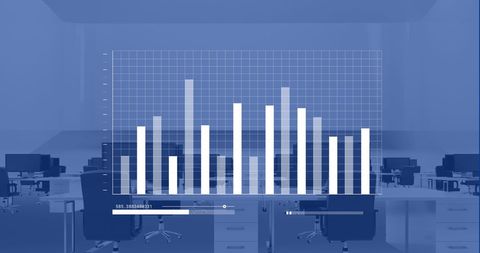
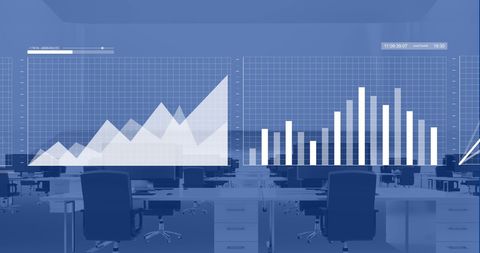
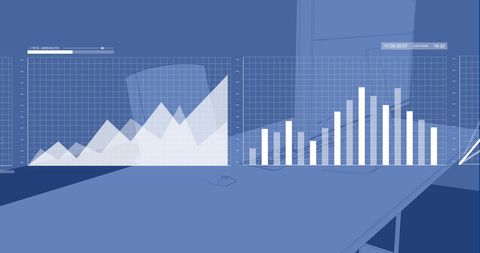
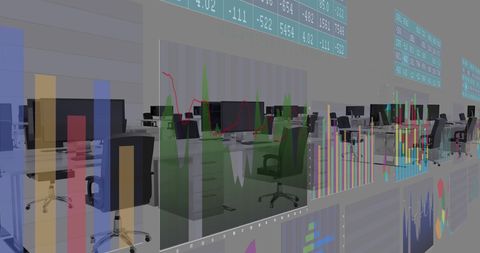
- Statistics Displayed Over Empty Office Background
Statistics Displayed Over Empty Office Background Image

Statistics and bar charts display against a sleek, empty office environment with wide glass windows and cityscape visible in the background. This image highlights the concept of business data technology and futuristic office designs. Useful for illustrating articles on finance, technology trends, data analysis, or modern office design concepts.
Powered by  - Get 15% off with code: PIKWIZARD15


downloads
Tags:
More
Credit Photo
If you would like to credit the Photo, here are some ways you can do so
Text Link
photo Link
<span class="text-link">
<span>
<a target="_blank" href=https://pikwizard.com/photo/statistics-displayed-over-empty-office-background/6d9d7c870b7d6d4d93daa02c6b9fc807/>PikWizard</a>
</span>
</span>
<span class="image-link">
<span
style="margin: 0 0 20px 0; display: inline-block; vertical-align: middle; width: 100%;"
>
<a
target="_blank"
href="https://pikwizard.com/photo/statistics-displayed-over-empty-office-background/6d9d7c870b7d6d4d93daa02c6b9fc807/"
style="text-decoration: none; font-size: 10px; margin: 0;"
>
<img src="https://pikwizard.com/pw/medium/6d9d7c870b7d6d4d93daa02c6b9fc807.jpg" style="margin: 0; width: 100%;" alt="" />
<p style="font-size: 12px; margin: 0;">PikWizard</p>
</a>
</span>
</span>
Free (free of charge)
Free for personal and commercial use.
Author: People Creations
Similar Free Stock Images

Premium


Premium

Premium

Premium

Premium


Premium


Premium

Premium


Premium


Premium


Premium


Premium


Premium


Premium


Premium


Premium


Premium


Premium


Premium

Premium


Premium


Premium

Premium

Premium


Premium


Explore More Free Stock Images