- Home >
- Stock Photos >
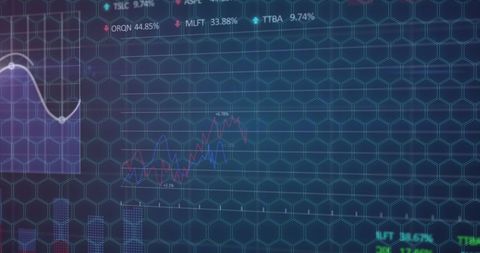
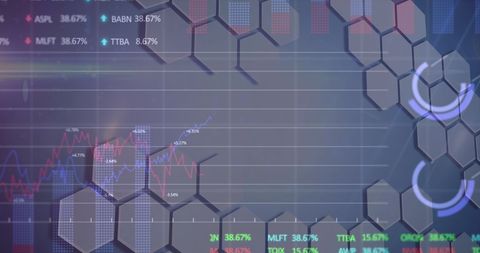
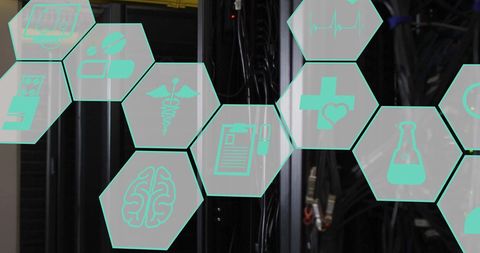
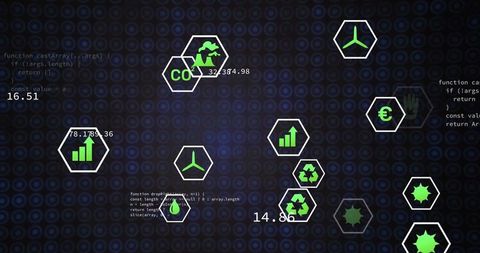
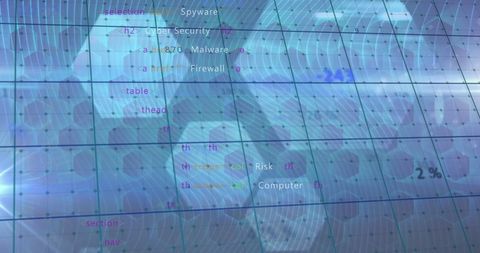
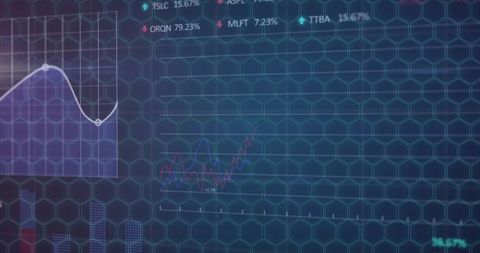
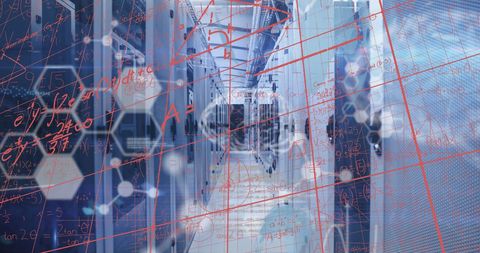
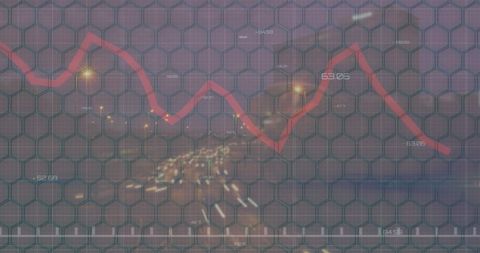
- Statistics Visualization on Modern Grey Interface
Statistics Visualization on Modern Grey Interface Image

Visualization illustrates complex data processing by superimposing multicolored line graph over hexagonal geometric patterns, creating an innovative and technological ambiance. Suitable for presentations on finance, statistics, or technology-related topics. Ideal for websites exploring digital transformations or tech innovations.

downloads
Tags:
More
Credit Photo
If you would like to credit the Photo, here are some ways you can do so
Text Link
photo Link
<span class="text-link">
<span>
<a target="_blank" href=https://pikwizard.com/photo/statistics-visualization-on-modern-grey-interface/617734ed80a6621090f705e16d43ed8a/>PikWizard</a>
</span>
</span>
<span class="image-link">
<span
style="margin: 0 0 20px 0; display: inline-block; vertical-align: middle; width: 100%;"
>
<a
target="_blank"
href="https://pikwizard.com/photo/statistics-visualization-on-modern-grey-interface/617734ed80a6621090f705e16d43ed8a/"
style="text-decoration: none; font-size: 10px; margin: 0;"
>
<img src="https://pikwizard.com/pw/medium/617734ed80a6621090f705e16d43ed8a.jpg" style="margin: 0; width: 100%;" alt="" />
<p style="font-size: 12px; margin: 0;">PikWizard</p>
</a>
</span>
</span>
Free (free of charge)
Free for personal and commercial use.
Author: Authentic Images