- Home >
- Stock Photos >
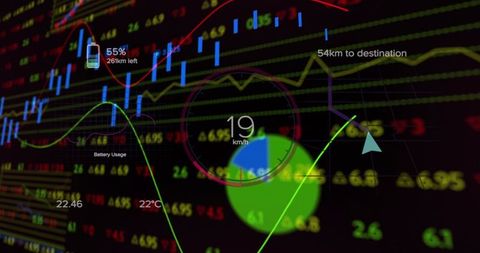
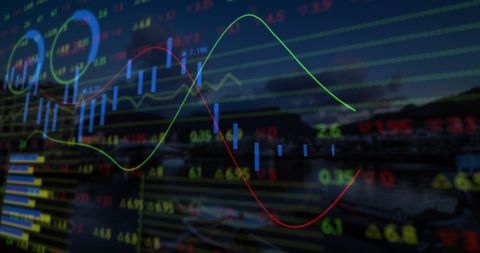
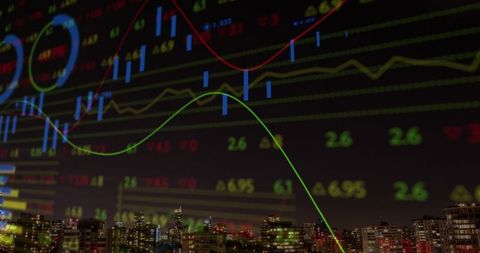
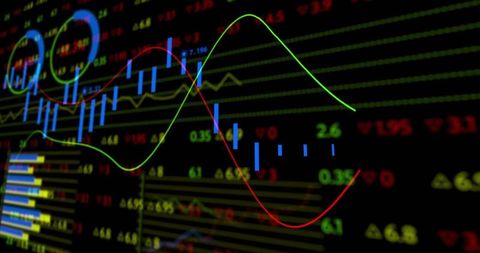
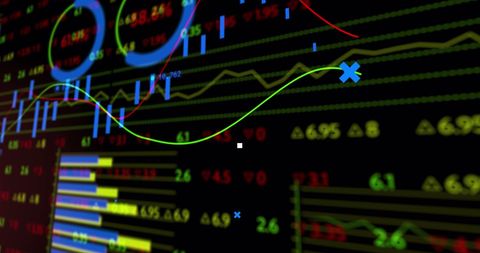
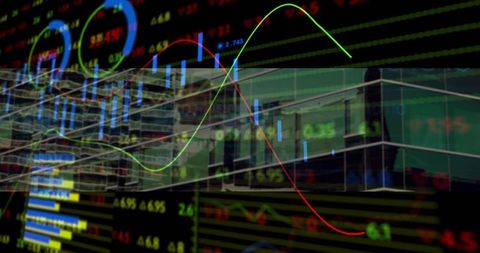
- Stock Exchange Data with Dynamic Graphs and Chart Display
Stock Exchange Data with Dynamic Graphs and Chart Display Image
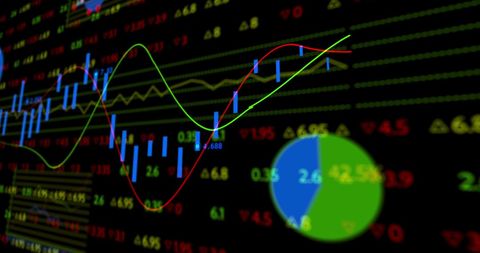
Interesting depiction of advanced stock exchange displays with fluctuating graphs and numeric data, useful for articles or analysis on global business trends. Suitable for illustrating concepts related to finance, trading, and market insights. Ideal for presentations and publications focusing on investment strategies and economic dynamics.

downloads
Tags:
More
Credit Photo
If you would like to credit the Photo, here are some ways you can do so
Text Link
photo Link
<span class="text-link">
<span>
<a target="_blank" href=https://pikwizard.com/photo/stock-exchange-data-with-dynamic-graphs-and-chart-display/745de80824d7a5a7f33a2bc680d36def/>PikWizard</a>
</span>
</span>
<span class="image-link">
<span
style="margin: 0 0 20px 0; display: inline-block; vertical-align: middle; width: 100%;"
>
<a
target="_blank"
href="https://pikwizard.com/photo/stock-exchange-data-with-dynamic-graphs-and-chart-display/745de80824d7a5a7f33a2bc680d36def/"
style="text-decoration: none; font-size: 10px; margin: 0;"
>
<img src="https://pikwizard.com/pw/medium/745de80824d7a5a7f33a2bc680d36def.jpg" style="margin: 0; width: 100%;" alt="" />
<p style="font-size: 12px; margin: 0;">PikWizard</p>
</a>
</span>
</span>
Free (free of charge)
Free for personal and commercial use.
Author: Awesome Content