
- Home >
- Stock Photos >
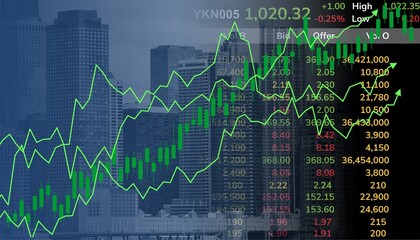
- Stock Market Analysis Display with Numeric Data Visualization
Stock Market Analysis Display with Numeric Data Visualization Image

Dynamic visualization of stock market numbers on blue background illustrating global economic trends. Useful for themes on finance, business analysis, financial market overview, or digital trading platforms.
Powered by 


downloads
Tags:
More
Credit Photo
If you would like to credit the Photo, here are some ways you can do so
Text Link
photo Link
<span class="text-link">
<span>
<a target="_blank" href=https://pikwizard.com/photo/stock-market-analysis-display-with-numeric-data-visualization/9fa84ec4280daf94891978f89bf68645/>PikWizard</a>
</span>
</span>
<span class="image-link">
<span
style="margin: 0 0 20px 0; display: inline-block; vertical-align: middle; width: 100%;"
>
<a
target="_blank"
href="https://pikwizard.com/photo/stock-market-analysis-display-with-numeric-data-visualization/9fa84ec4280daf94891978f89bf68645/"
style="text-decoration: none; font-size: 10px; margin: 0;"
>
<img src="https://pikwizard.com/pw/medium/9fa84ec4280daf94891978f89bf68645.jpg" style="margin: 0; width: 100%;" alt="" />
<p style="font-size: 12px; margin: 0;">PikWizard</p>
</a>
</span>
</span>
Free (free of charge)
Free for personal and commercial use.
Author: Creative Art
Similar Free Stock Images

Premium


Premium


Premium

Premium


Premium


Premium


Premium

Premium


Premium


Premium

Premium


Premium


Premium


Premium


Premium


Premium


Premium


Premium


Premium


Premium


Premium


Premium

Premium


Premium


Premium


Explore More Free Stock Images