- Home >
- Stock Photos >
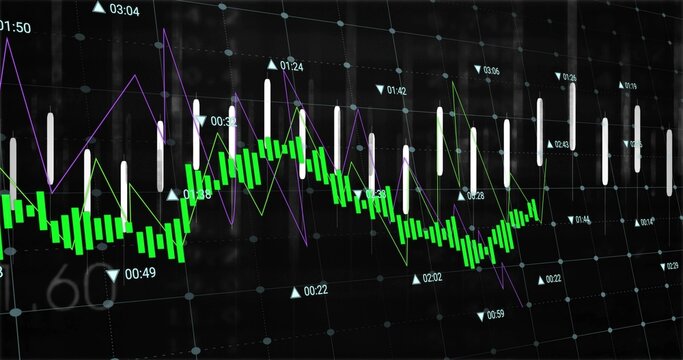
- Stock Market Analysis with 3D Digital Trading Dashboard Interface
Stock Market Analysis with 3D Digital Trading Dashboard Interface Image

This digital illustration portrays a stock market analysis interface with 3D elements, featuring candlestick charts, trend lines, and percentage growth labels. It is ideal for conveying themes of financial analysis, investment strategies, business technology advancements, and trading education material in presentations, websites, or reports.
Powered by 


0
downloads
downloads
Tags:
More
Credit Photo
If you would like to credit the Photo, here are some ways you can do so
Text Link
photo Link
<span class="text-link">
<span>
<a target="_blank" href=https://pikwizard.com/photo/stock-market-analysis-with-3d-digital-trading-dashboard-interface/41424566afcb30f804c1ecbe33b9eb64/>PikWizard</a>
</span>
</span>
<span class="image-link">
<span
style="margin: 0 0 20px 0; display: inline-block; vertical-align: middle; width: 100%;"
>
<a
target="_blank"
href="https://pikwizard.com/photo/stock-market-analysis-with-3d-digital-trading-dashboard-interface/41424566afcb30f804c1ecbe33b9eb64/"
style="text-decoration: none; font-size: 10px; margin: 0;"
>
<img src="https://pikwizard.com/pw/medium/41424566afcb30f804c1ecbe33b9eb64.jpg" style="margin: 0; width: 100%;" alt="" />
<p style="font-size: 12px; margin: 0;">PikWizard</p>
</a>
</span>
</span>
Free (free of charge)
Free for personal and commercial use.
Author: Creative Art
Similar Free Stock Images

Premium


Premium


Premium


Premium


Premium


Premium


Premium


Premium


Premium


Premium


Premium


Premium


Premium


Premium


Premium


Premium


Premium


Premium


Premium


Premium


Premium


Premium


Premium


Premium