- Home >
- Stock Photos >
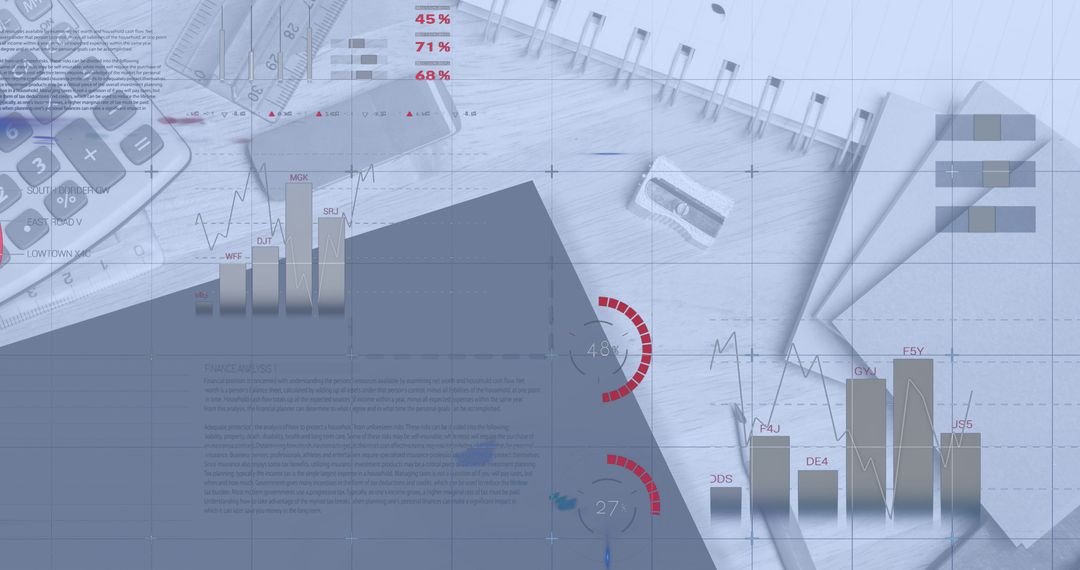
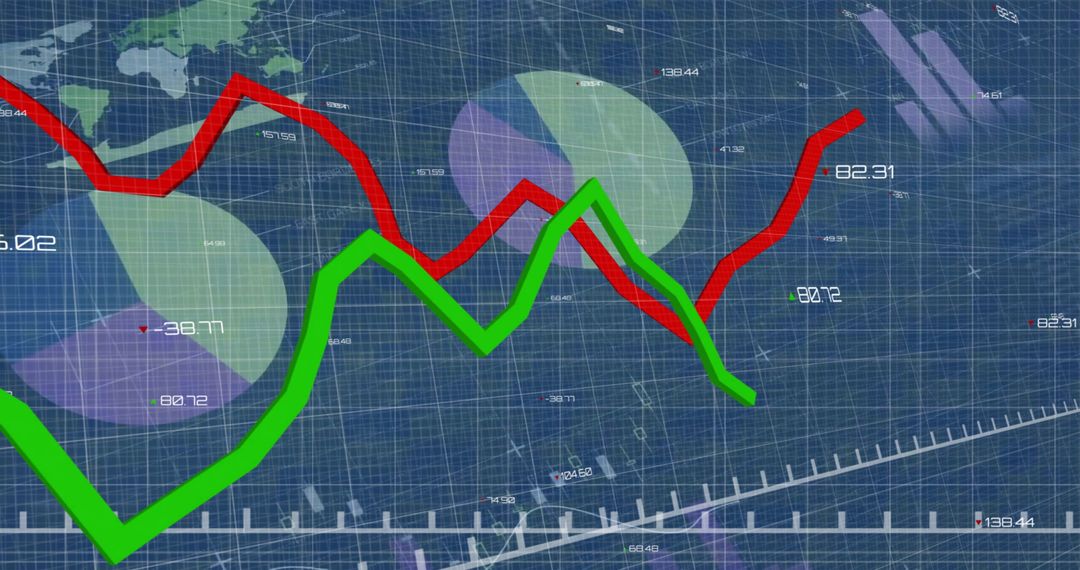
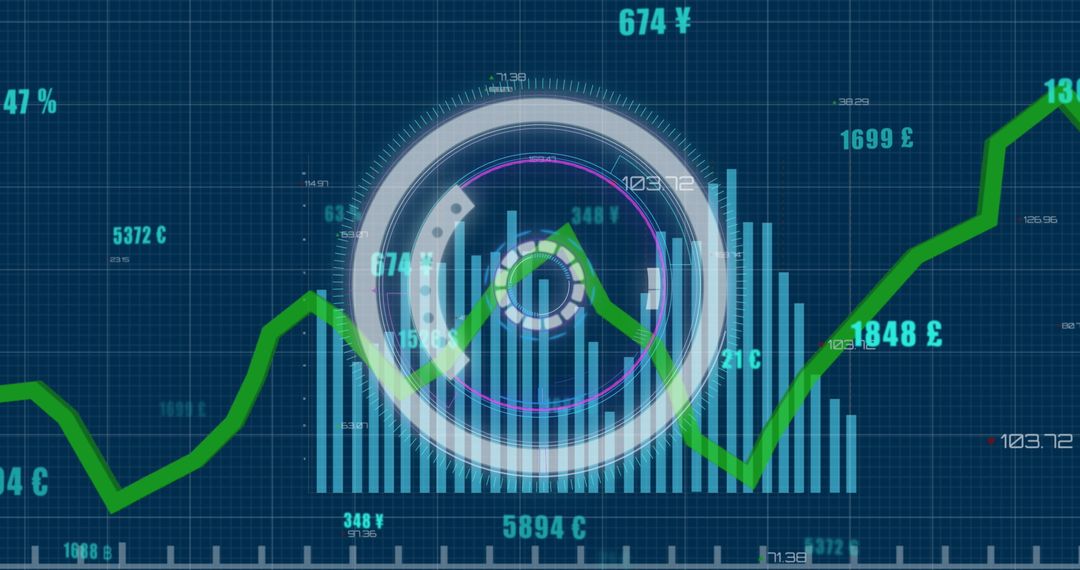
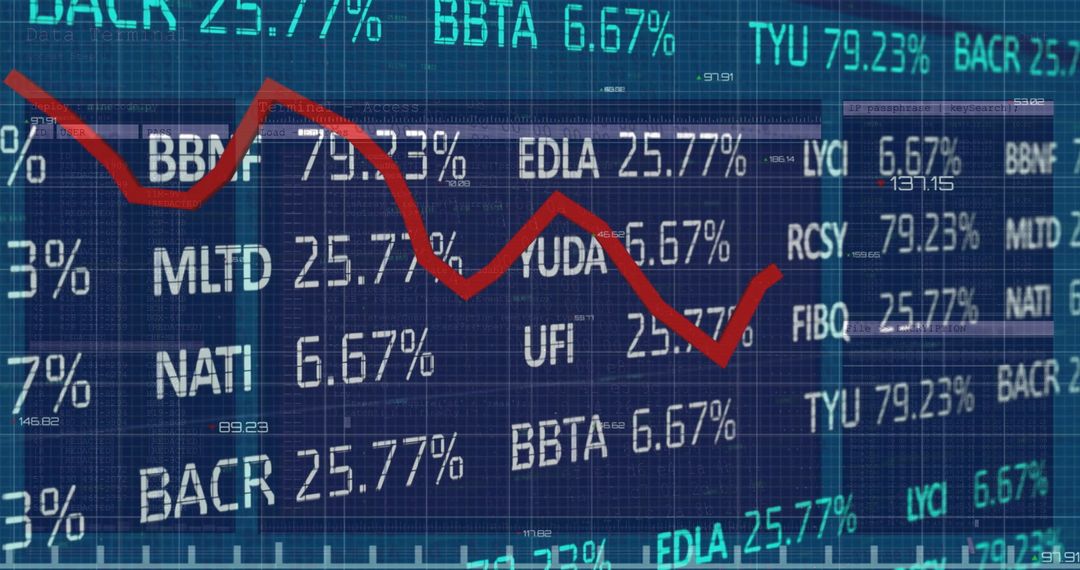
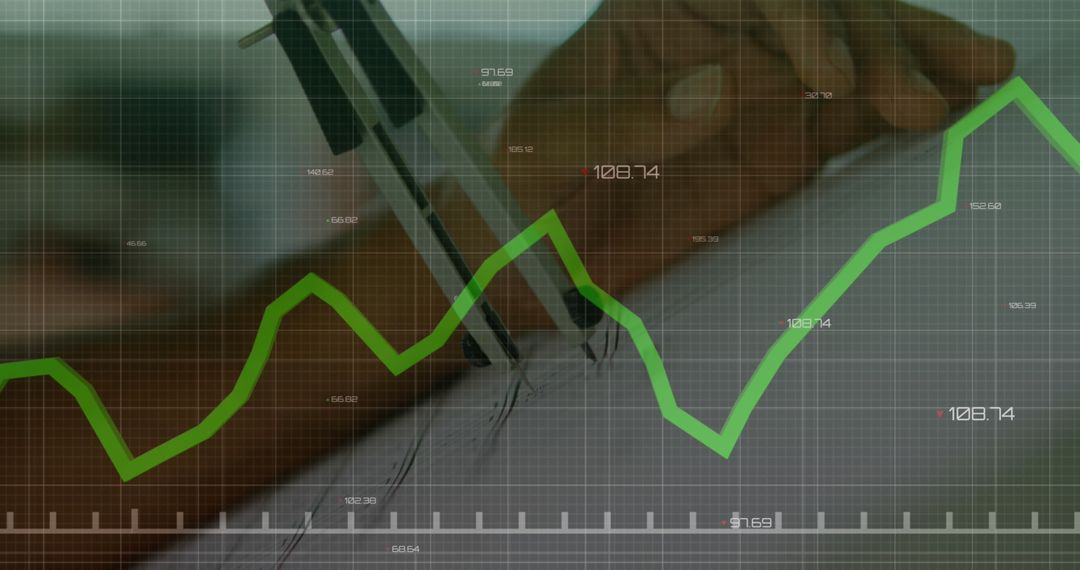
- Stock Market Analysis with Digital Network and Connections Concept
Stock Market Analysis with Digital Network and Connections Concept Image

Depiction of stock market data integrated with digital networks and connections. Ideal for illustrating concepts of global finance, technology in economics, and digital market analysis. Useful for business websites, technology blogs, or educational materials related to financial literacy and economic trends.
Powered by  - Get 15% off with code: PIKWIZARD15


2
downloads
downloads
Tags:
More
Credit Photo
If you would like to credit the Photo, here are some ways you can do so
Text Link
photo Link
<span class="text-link">
<span>
<a target="_blank" href=https://pikwizard.com/photo/stock-market-analysis-with-digital-network-and-connections-concept/9ccef6f52ab55db780551ed6d8b038ab/>PikWizard</a>
</span>
</span>
<span class="image-link">
<span
style="margin: 0 0 20px 0; display: inline-block; vertical-align: middle; width: 100%;"
>
<a
target="_blank"
href="https://pikwizard.com/photo/stock-market-analysis-with-digital-network-and-connections-concept/9ccef6f52ab55db780551ed6d8b038ab/"
style="text-decoration: none; font-size: 10px; margin: 0;"
>
<img src="https://pikwizard.com/pw/medium/9ccef6f52ab55db780551ed6d8b038ab.jpg" style="margin: 0; width: 100%;" alt="" />
<p style="font-size: 12px; margin: 0;">PikWizard</p>
</a>
</span>
</span>
Free (free of charge)
Free for personal and commercial use.
Author: Creative Art
Similar Free Stock Images

Premium


Premium


Premium


Premium


Premium


Premium


Premium


Premium


Premium


Premium


Premium


Premium


Premium


Premium


Premium


Premium


Premium


Premium


Premium


Premium


Premium


Premium


Premium


Premium