- Home >
- Stock Photos >
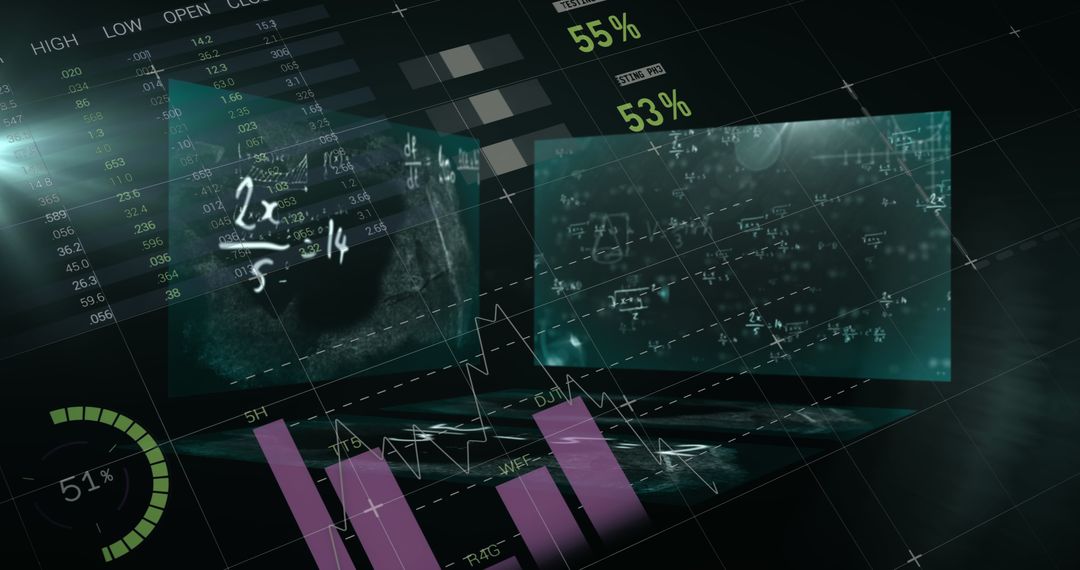
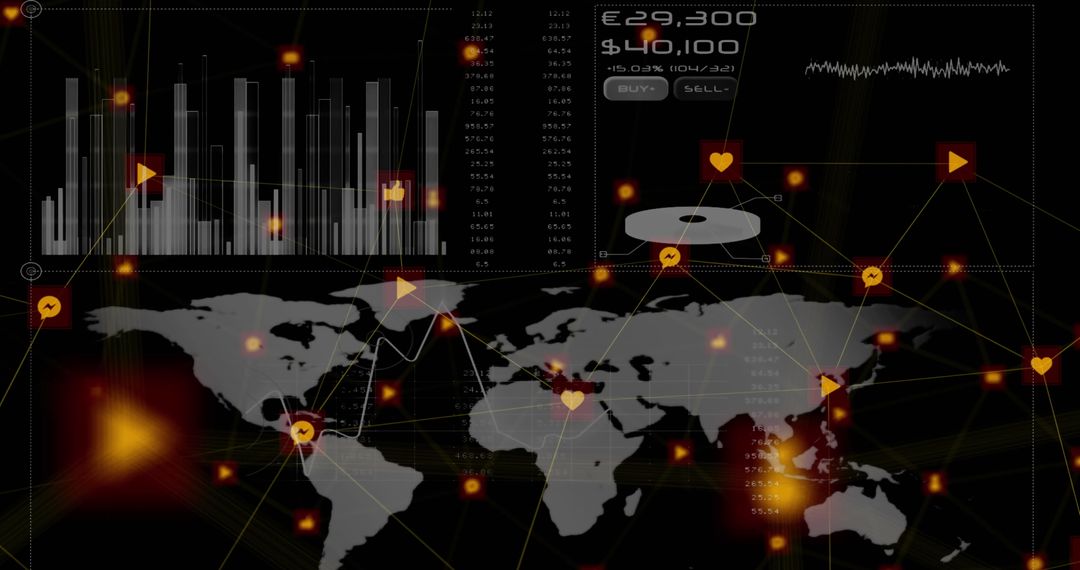
- Stock Market Analysis with Globe and Trend Graphs
Stock Market Analysis with Globe and Trend Graphs Image
This digital art showcases concepts of stock market analysis and globalization. With trend graphs and a globe formation, it captures the essence of modern business and finance. Useful for financial reports, business presentations, and educational materials focusing on data analytics and global communication.
Powered by 


4
downloads
downloads
Tags:
More
Credit Photo
If you would like to credit the Photo, here are some ways you can do so
Text Link
photo Link
<span class="text-link">
<span>
<a target="_blank" href=https://pikwizard.com/photo/stock-market-analysis-with-globe-and-trend-graphs/997fb2de6013a51628ce68a421571eb5/>PikWizard</a>
</span>
</span>
<span class="image-link">
<span
style="margin: 0 0 20px 0; display: inline-block; vertical-align: middle; width: 100%;"
>
<a
target="_blank"
href="https://pikwizard.com/photo/stock-market-analysis-with-globe-and-trend-graphs/997fb2de6013a51628ce68a421571eb5/"
style="text-decoration: none; font-size: 10px; margin: 0;"
>
<img src="https://pikwizard.com/pw/medium/997fb2de6013a51628ce68a421571eb5.jpg" style="margin: 0; width: 100%;" alt="" />
<p style="font-size: 12px; margin: 0;">PikWizard</p>
</a>
</span>
</span>
Free (free of charge)
Free for personal and commercial use.
Author: Creative Art
Similar Free Stock Images

Premium


Premium


Premium


Premium


Premium


Premium


Premium


Premium


Premium


Premium


Premium


Premium


Premium


Premium


Premium


Premium


Premium


Premium


Premium


Premium


Premium


Premium


Premium


Premium