1. Home > 
  2. Stock Photos > 
  3. Stock Market Analysis with Overlay of Financial Graphs on Computer Screen

Stock Market Analysis with Overlay of Financial Graphs on Computer Screen Image

Stock Market Analysis with Overlay of Financial Graphs on Computer Screen

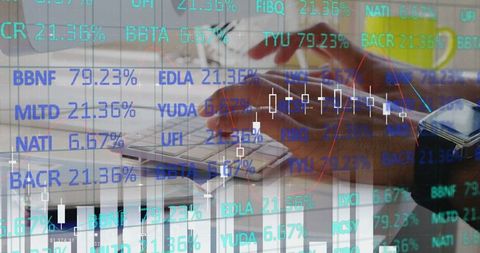
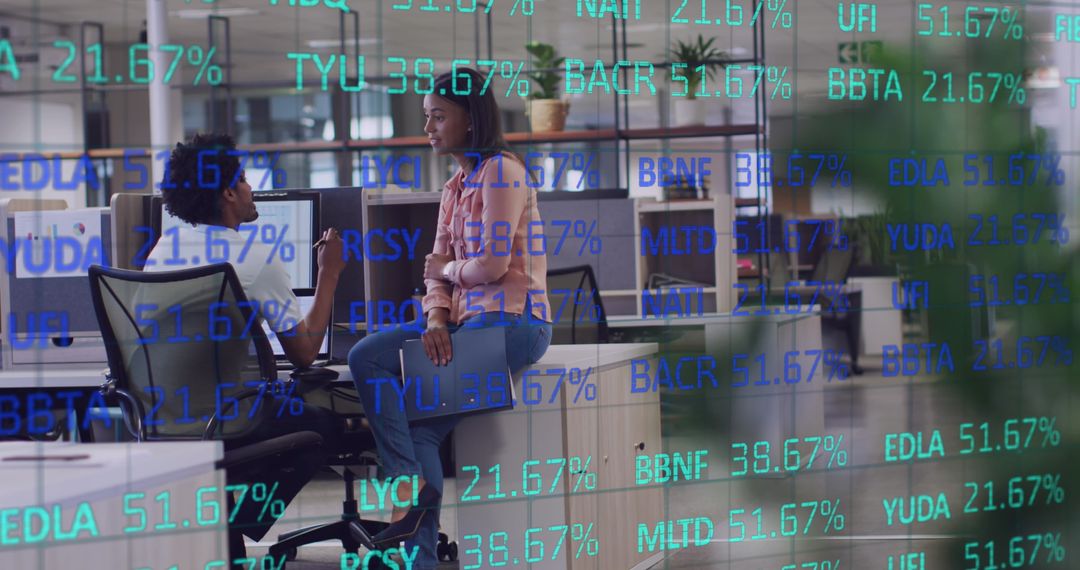
Hands typing on keyboard appear overlaid with stock market graphs and percentages. This image is ideal for illustrating articles about financial analysis, investment strategies, economic trends, and the use of technology in business. Perfect for financial planning brochures, investment consulting presentation slides, or economic research reports.

Powered by Adobe logo
Financial market data analysis with glowing 3D bar and line charts on dark background showing economic trends and growth concept visualization. 3D Rendering - Powered by AdobeMobile Technology Financial Analysis: Person Using Smartphone with Augmented Reality Interface for Stock Market Data - Powered by Adobestock market visual metaphor concept. A crystal ball displaying financial graph trends on a dark cushion. - Powered by AdobeBusiness financial chart with moving up arrow graph.Financial data charts with glowing stock market graphs.Stock market investment data and analysis finance graph.  - Powered by AdobeFocused businessman doing financial analysis with data on chart. Using laptop and tablet with stylus for market research, strategy, and investment growth - Powered by Adobe

Credit Photo

If you would like to credit the Photo, here are some ways you can do so

Free (free of charge)

Free for personal and commercial use.

Author: Creative Art

Similar Free Stock Images

Businessman Analyzing Financial Data with Graphical Overlay
Premium
Magnifying glass highlights stock chart decline. Financial analysis, investment review, economic downturn scrutiny, and market volatility insights.
Digital Financial Analysis with Business Professionals
Black Woman Analyzing Financial Data in Modern Office Setting
Dynamic Stock Market Data Analysis with Technology
Multiracial Business Team Analyzing Financial Data
Premium
 An economic report on how interest rates affect business growth
Children Interacting with Digital Interface in Futuristic Classroom
Data Processing with Global Shipping Concept in Warehouse
Business Professionals Analyzing Financial Data and Global Stock Trends
Businessman Analyzing Financial Charts with Smartphone and Laptop
Premium
Magnifying glass highlights business growth chart with upward trend. Generative AI analysis financial success stock increase profit investment statistic performance market economy improvement
Financial Data Overlay on Business People in Modern Office
Teamwork in Financial Planning with Data Analysis Integration
Collaborative Teamwork in Front of Financial Data Projections
Financial Data Analysis with Person Interacting
Premium
Digital glowing stock market chart with options trend and index data on a dark background, symbolizing economic growth, trading, and financial technology.
Financial Analysis and Global Market Strategies Concept
Global Finance Dashboard Overlay on City Skyline
Businesswoman Analyzing Data on Smartphone with Futuristic Charts
Financial Analysis with Futuristic Data Overlay
Premium
Orange financial charts over city skyline at sunset stock market trading
Women in Finance Working with Digital Interface and Data Analytics
Diverse Professionals Working with Stock Market Data
Business Professionals Analyzing Financial Growth Charts Digital Interface
Financial Analyst Drafting Design with Stock Tickers Overlap
Premium
Fear and Greed Index gauge showing extreme fear with red indicator fear greed index
Businessman Analyzing Financial Data on Laptop Reflected with Stock Tickers
Women Collaborating with Holographic Overlays Enhancing Data Analysis
Corporate Team Analyzing Stock Data in Open Office Setting
Remote Business Strategy Meeting with Data Analysis Charts Overlay
Financial Data Analysis on Digital Computer Display
Financial Data Processing with Business Team in Modern Office
Premium
Modern finance office showcasing stock market data trends, ideal for investment strategies and financial analysis content creation, promoting success and growth
Digital Trading Data Overlaid on Office Workspace
Businesswoman Analysing Financial Data at Modern Office
Digital Interface of Business Icons Behind Corporate Meeting
Tech Professional Analyzing Growth Data on Smartphone
Premium
Businesswoman using tablet with stock market chart overlay on dark background for financial analysis and digital investment presentation template.
Business Professionals Analyzing Real-Time Financial Data
Man Analyzing Stock Market on Laptop with Data Graph Overlay
Happy Schoolgirl Blended with Financial Data Visuals
Integrating Financial Data with Multicultural Team Interaction in Modern Office
Premium
Green arrow pointing upward on financial graph. Business growth chart with rising trend line. Digital stock market data visualization for investment analysis
Business Meeting with Financial Data Graphics Overlay
Data Processing Overlay on Business Team in Meeting
Diverse Team Analyzing Financial Technology in Modern Office
Corporate Professionals Analyzing Financial Data with Graphs Overlay
Premium
Close up of a finger pointing at a glowing stock market candlestick chart with a trend line
Children and Financial Data Overlap Concept
Financial Analyst Reviewing Data and Graphs on Laptop
Digital Finance Visualization with Graphs and Analytics
Digital Financial Analysis with Laptop Integration
Premium
Gold bars and a magnifying glass on a stock market chart. Concept Gold bars, Magnifying glass, Stock market chart, Financial analysis, Investment trends
Financial Analyst Working with Complex Data Visualizations
Multitasking in Modern Office: Digital Integration Concepts
Businessman Analyzing Stock Market Trends on Laptop with Data Overlay
Professionals Collaborating on Stock Market Analysis in Modern Office
Premium
Modern city skyline at night with digital financial data and stock market charts.
Businessman Collaborating in Modern Office Environment
Hands Typing with Smartwatch and Financial Charts Overlay
Businesswoman Analyzing Data with Stock Market Grid Overlay
Businesswoman Analyzing Financial Data Matrix Interface
Global Data Operational Workflow in Modern Office
Global Marketing Strategies Reflected in Office Setting
Premium
Hand interacting with financial stock market trading candlestick charts analyzing growth opportunities and investment strategies
Hands Typing Keyboard Overlaying Financial Data Display
Financial Analysis with Digital Interface and Businesswoman
IT Professional Coding with Digital Binary Overlay in Modern Workspace
Young Businessman Celebrating Successful Stock Market Sales
Premium
Renewable Energy Investment and Financial Growth with Wind Turbines and Solar Panels Overlayed with Stock Market Charts and Data
Double Exposure of Financial Charts with Modern Office Background
Businesswoman Smiling with Financial Data Overlapped in Office Setting
Business Professionals Overlaid with Stock Market Data Graphics
Colleagues Discussing Business Statistics in Modern Office
Premium
Abstract blue glowing stock market chart with uptrend line and bokeh, concept for financial analysis, investment strategy and business forecasting
Abstract Stock Market Data Overlaying Warehouse Background
Caucasian Businessman Analyzing Data on Digital Interface
Collaboration in Digital Financial Analysis Environment
Business Team Analyzing Digital Financial and Stock Market Data
Premium
US business news , financial analysis , world economic information , stock market trend
Financial Data Analysis in Digital Server Room
Digital Financial Data Overlay in Empty Modern Office
Medical Team Analyzing Lab Findings with Data Overlays
Financial Analytics with Diverse Business Team in Modern Office
Premium
Transparent or png stock market investment trading graph growth.Trade business analytics graph and financial chart.
Innovative Team Discussion with Interactive Digital Charts
Professional Woman Analyzing Financial Charts on Tablet in Modern Office
Financial Analysts Discussing Stock Figures on Digital Display
Doctor Analyzing Financial Data with Modern Technology
Premium
Business Growth Visualization with Hand and Pen on Graph
Virtual Meeting on Laptop with Financial Background in Modern Office
Asian Businesswoman Analyzing Stock Data on Laptop in Modern Office
Businesswomen Interacting with Digitized Financial Data Overlay
Diverse Professionals Brainstorming in Corporate Office with Data Overlay
Blonde Businesswoman Analyzing Financial Data with Futuristic Interface
Digital Financial Data Overlays Business Team in Modern Office
Premium
Magnifying glass highlights business growth chart with upward trend. Generative AI analysis financial success stock increase profit investment statistic performance market economy improvement
Colleagues Analyzing Financial Data in Modern Office with Digital Overlay
Businessman Analyzing Digital Stock Data in Modern Loft Office
Businesswoman Analyzing Financial Projections on Transparent Screen
Business Colleagues Analyzing Financial Market Trends and Data
Premium

Dynamic blue and green digital stock market graph with bar charts and lines on a dark background, representing financial data analysis, investment trends, business growth, and global economy fluctuat
Creative Businesswoman Analyzing Financial Data Visuals in Futuristic Office
Digital Data Overlay on Business Conference
Business Team Collaboration Overlaid with Financial Charts
Architects Analyzing Plans with Data Overlay at Construction Site
Premium
Crude oil barrels reflecting stock market volatility against a dark background, perfect for financial analysis and energy sector reports
Innovative Learning: Anchoring Education in Digital Analytics
Collaborative Business Team Working with Financial Data Trends
Woman Analyzing Data with Mathematical Formulas Overlay
Double Exposure of Candlestick Chart and Business Office
Premium
Abstract digital stock market chart with glowing blue lines and bokeh effects representing financial growth and analysis.
Analytics and Financial Data with Urban Cityscape Overlay
Financial Data Over Businesspeople with Market Graph Indicators
Business Professionals Analyzing Stock Data on Display
Diverse Team Engaged in Data Analysis Meeting in Modern Office
Premium
Drive your business growth like a pro with data-driven insights for financial success and prosperity
Diverse Team Brainstorming with Digital Interface in Modern Office
Data Analyst Working with Digital Charts on Monitors in Office
Digital Holographic Interface in Modern Classroom Setting
Finance Experts Analyzing Data in Modern Corporate Office
Premium
Stethoscope on glowing digital financial display with pink, blue hues. Shows market analysis, stock data, economy trends, business investment graphs. Futuristic interface with bright abstract
Businesswoman Analyzing Financial Data with Digital Overlay Modern Office