
- Home >
- Stock Photos >
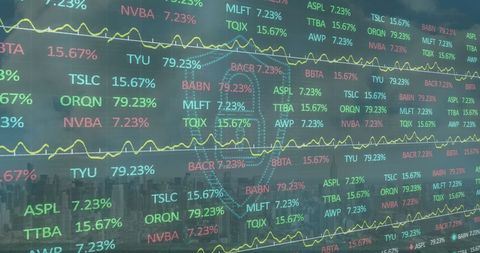
- Stock Market Analytics Intersecting with Renewable Energy Innovation
Stock Market Analytics Intersecting with Renewable Energy Innovation Image

A businessman reflects in front of a screen displaying dynamic stock market data intertwining with the concept of wind energy production. This visual representation highlights the merging landscapes of finance and renewable energy in today's global economy. Suitable for topics on sustainable growth, technology in finance, investment in renewable resources, and the changing dynamics of market strategies.
Powered by 


downloads
Tags:
More
Credit Photo
If you would like to credit the Photo, here are some ways you can do so
Text Link
photo Link
<span class="text-link">
<span>
<a target="_blank" href=https://pikwizard.com/photo/stock-market-analytics-intersecting-with-renewable-energy-innovation/64df3f23373b0f341cddc538772db010/>PikWizard</a>
</span>
</span>
<span class="image-link">
<span
style="margin: 0 0 20px 0; display: inline-block; vertical-align: middle; width: 100%;"
>
<a
target="_blank"
href="https://pikwizard.com/photo/stock-market-analytics-intersecting-with-renewable-energy-innovation/64df3f23373b0f341cddc538772db010/"
style="text-decoration: none; font-size: 10px; margin: 0;"
>
<img src="https://pikwizard.com/pw/medium/64df3f23373b0f341cddc538772db010.jpg" style="margin: 0; width: 100%;" alt="" />
<p style="font-size: 12px; margin: 0;">PikWizard</p>
</a>
</span>
</span>
Free (free of charge)
Free for personal and commercial use.
Author: Creative Art
Similar Free Stock Images
Loading...

Premium


Premium


Premium


Premium


Premium


Premium


Premium


Premium


Premium


Premium


Premium


Premium


Premium

Premium

Premium


Premium


Premium


Premium


Premium


Premium


Premium

Premium

Premium


Premium


Premium


Explore More Free Stock Images