
- Home >
- Stock Photos >
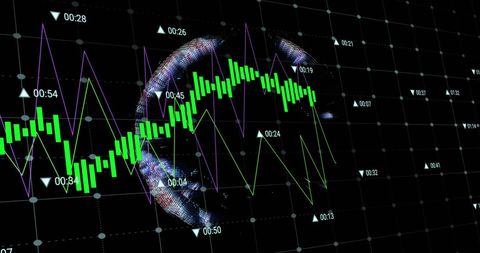
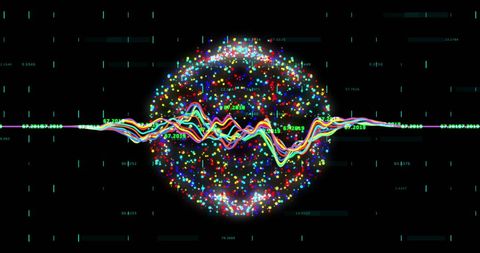
- Stock Market Candlestick Graph on Digital Globe Background
Stock Market Candlestick Graph on Digital Globe Background Image

A digital depiction showing stock market trends with a candlestick chart superimposed on a globe background. Useful for illustrating global financial market analyses, investment strategies, and financial technology concepts in presentations or reports.
Powered by  - Get 15% off with code: PIKWIZARD15


downloads
Tags:
More
Credit Photo
If you would like to credit the Photo, here are some ways you can do so
Text Link
photo Link
<span class="text-link">
<span>
<a target="_blank" href=https://pikwizard.com/photo/stock-market-candlestick-graph-on-digital-globe-background/2ed7112aeeae8fca649466cdbb126ebd/>PikWizard</a>
</span>
</span>
<span class="image-link">
<span
style="margin: 0 0 20px 0; display: inline-block; vertical-align: middle; width: 100%;"
>
<a
target="_blank"
href="https://pikwizard.com/photo/stock-market-candlestick-graph-on-digital-globe-background/2ed7112aeeae8fca649466cdbb126ebd/"
style="text-decoration: none; font-size: 10px; margin: 0;"
>
<img src="https://pikwizard.com/pw/medium/2ed7112aeeae8fca649466cdbb126ebd.jpg" style="margin: 0; width: 100%;" alt="" />
<p style="font-size: 12px; margin: 0;">PikWizard</p>
</a>
</span>
</span>
Free (free of charge)
Free for personal and commercial use.
Author: People Creations
Similar Free Stock Images
Loading...

Premium


Premium


Premium

Premium


Premium


Premium


Premium


Premium


Premium


Premium


Premium


Premium


Premium


Premium


Premium

Premium

Premium


Premium


Premium

Premium


Premium

Premium


Premium


Premium


Premium
