- Home >
- Stock Photos >
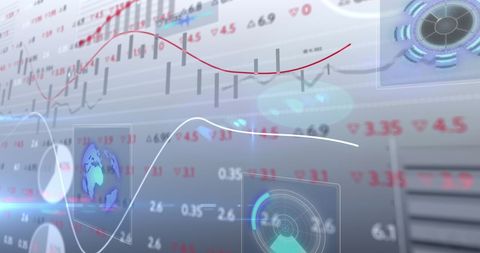
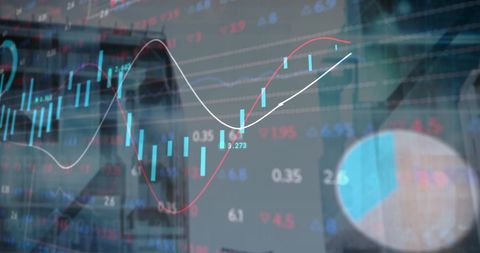
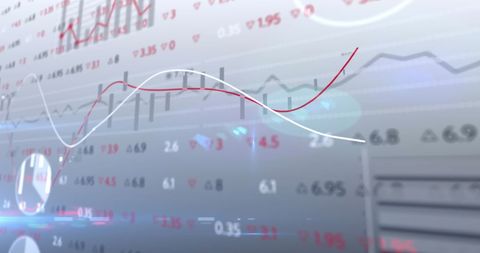
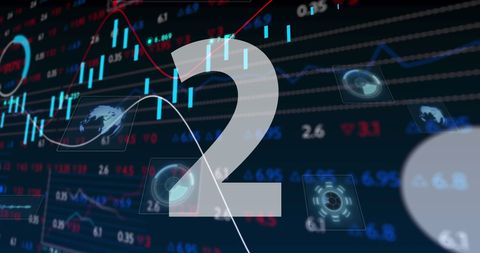
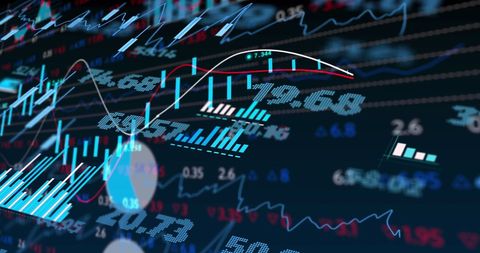
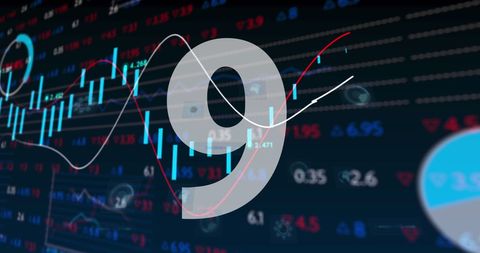
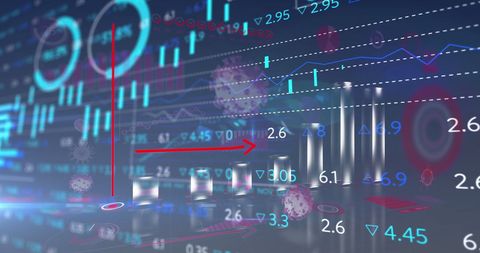
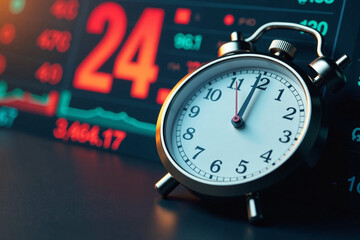
- Stock Market Countdown with Trading Indicators and Charts
Stock Market Countdown with Trading Indicators and Charts Image

Digital display featuring countdown numbers overlaying stock market graphs and technical indicators. Use for financial trading platforms, economic analysis publications, or technology-driven investment tools. Captures dynamic blend of financial data visualization and modern analytics.
Powered by 


downloads
Tags:
More
Credit Photo
If you would like to credit the Photo, here are some ways you can do so
Text Link
photo Link
<span class="text-link">
<span>
<a target="_blank" href=https://pikwizard.com/photo/stock-market-countdown-with-trading-indicators-and-charts/490373a6c18b7602a6bc93970fed2eb8/>PikWizard</a>
</span>
</span>
<span class="image-link">
<span
style="margin: 0 0 20px 0; display: inline-block; vertical-align: middle; width: 100%;"
>
<a
target="_blank"
href="https://pikwizard.com/photo/stock-market-countdown-with-trading-indicators-and-charts/490373a6c18b7602a6bc93970fed2eb8/"
style="text-decoration: none; font-size: 10px; margin: 0;"
>
<img src="https://pikwizard.com/pw/medium/490373a6c18b7602a6bc93970fed2eb8.jpg" style="margin: 0; width: 100%;" alt="" />
<p style="font-size: 12px; margin: 0;">PikWizard</p>
</a>
</span>
</span>
Free (free of charge)
Free for personal and commercial use.
Author: Awesome Content
Similar Free Stock Images
Loading...

Premium


Premium


Premium


Premium


Premium


Premium


Premium


Premium


Premium


Premium


Premium

Premium


Premium


Premium


Premium


Premium


Premium


Premium


Premium


Premium


Premium


Premium
Premium


Premium


Premium