- Home >
- Stock Photos >
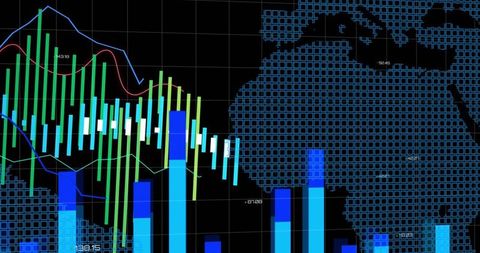
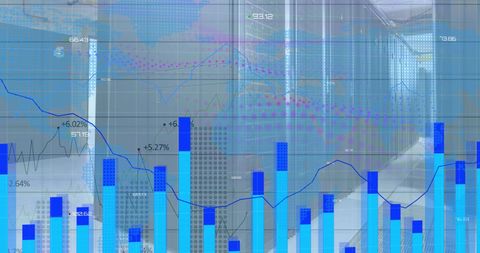
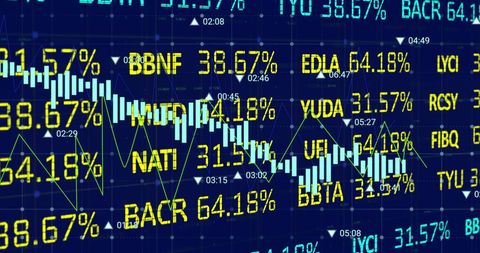
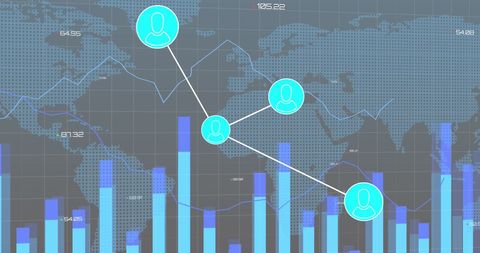
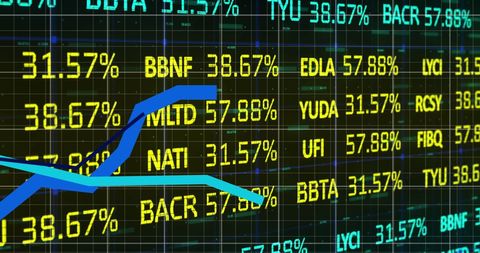
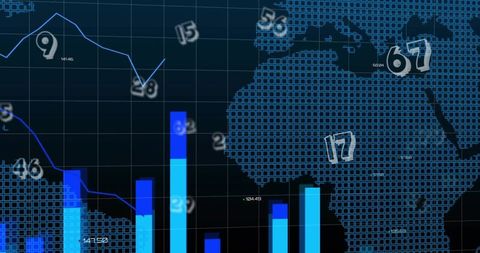
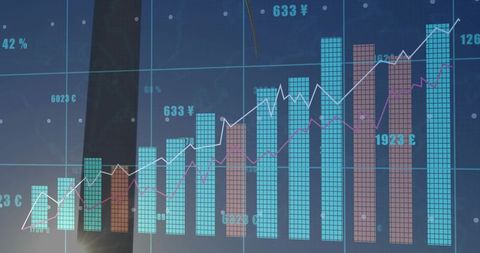
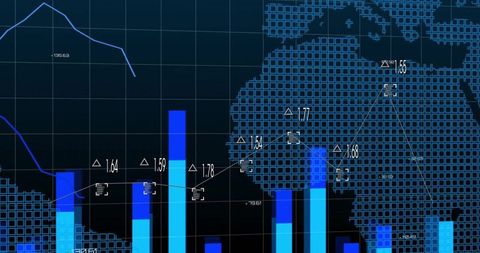
- Stock Market Data Analytics Over World Map Background
Stock Market Data Analytics Over World Map Background Image

Visual of financial data flowing with stock symbols and percentages overlaying a world map. Represents global finance, investment opportunities, and market analysis. Useful for illustrations of international trade, economic articles, cryptocurrency trends, financial reports, and business presentations.

downloads
Tags:
More
Credit Photo
If you would like to credit the Photo, here are some ways you can do so
Text Link
photo Link
<span class="text-link">
<span>
<a target="_blank" href=https://pikwizard.com/photo/stock-market-data-analytics-over-world-map-background/a75ae18f044c76ff4467ec3b97255e69/>PikWizard</a>
</span>
</span>
<span class="image-link">
<span
style="margin: 0 0 20px 0; display: inline-block; vertical-align: middle; width: 100%;"
>
<a
target="_blank"
href="https://pikwizard.com/photo/stock-market-data-analytics-over-world-map-background/a75ae18f044c76ff4467ec3b97255e69/"
style="text-decoration: none; font-size: 10px; margin: 0;"
>
<img src="https://pikwizard.com/pw/medium/a75ae18f044c76ff4467ec3b97255e69.jpg" style="margin: 0; width: 100%;" alt="" />
<p style="font-size: 12px; margin: 0;">PikWizard</p>
</a>
</span>
</span>
Free (free of charge)
Free for personal and commercial use.
Author: People Creations