
- Home >
- Stock Photos >
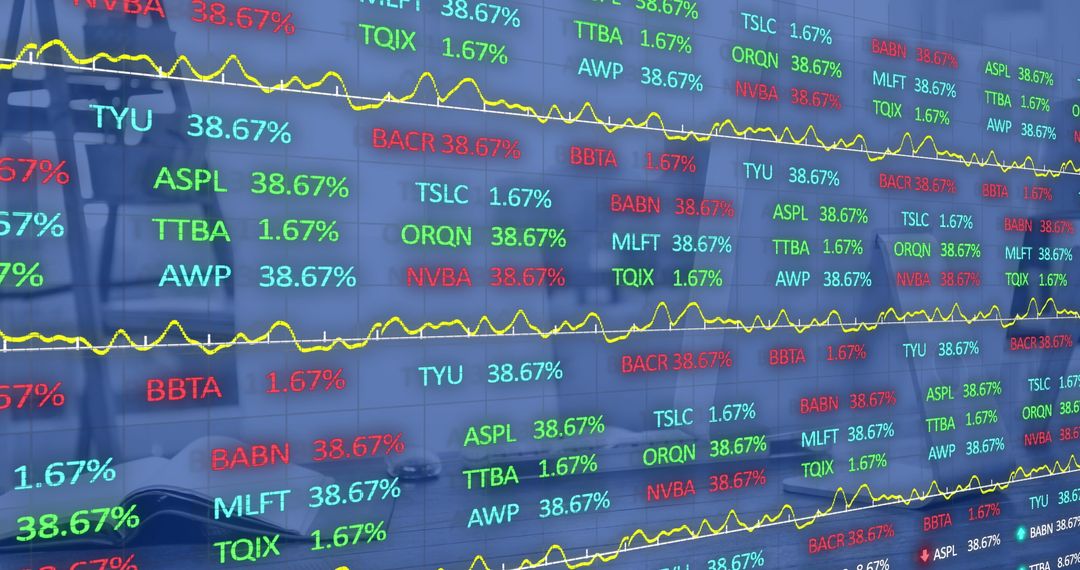
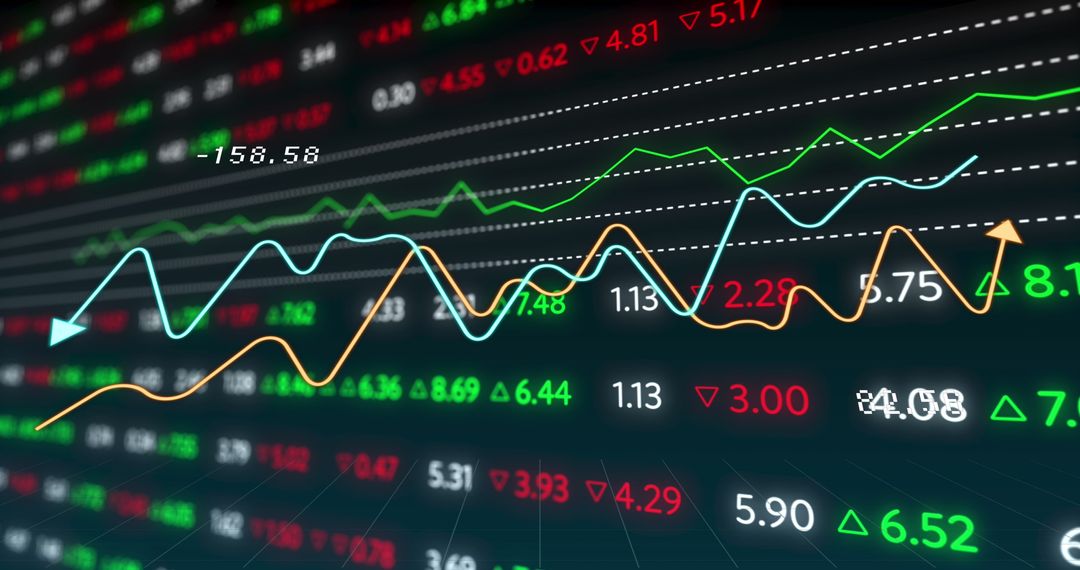
- Stock Market Data Display with Professional Analyzing
Stock Market Data Display with Professional Analyzing Image

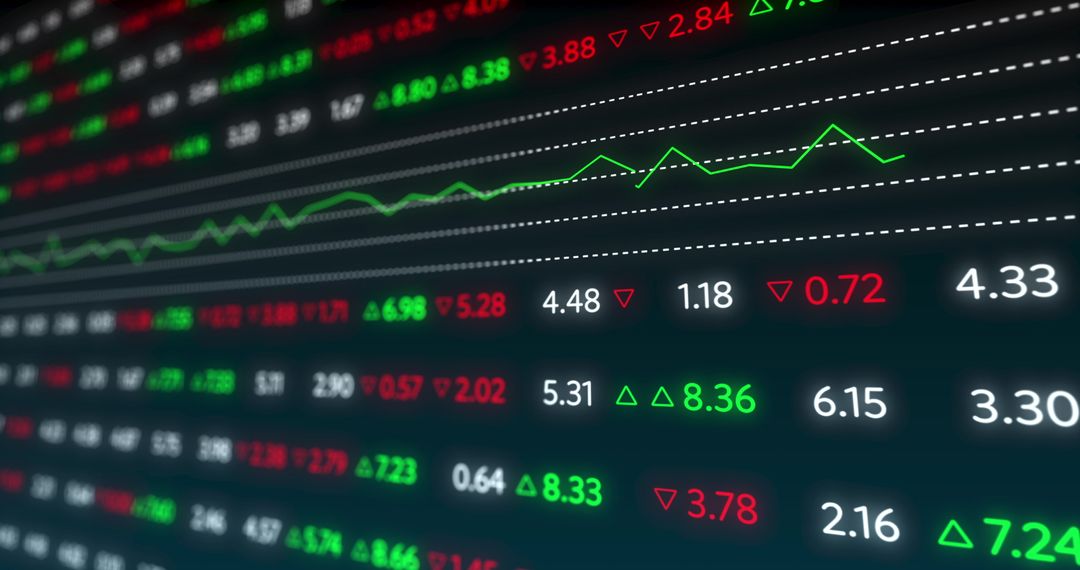
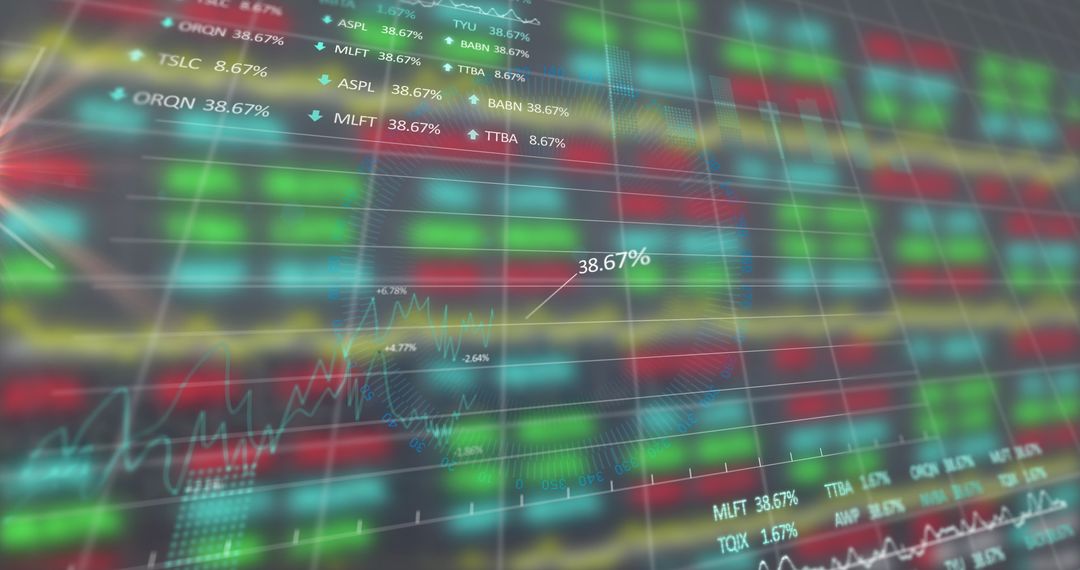
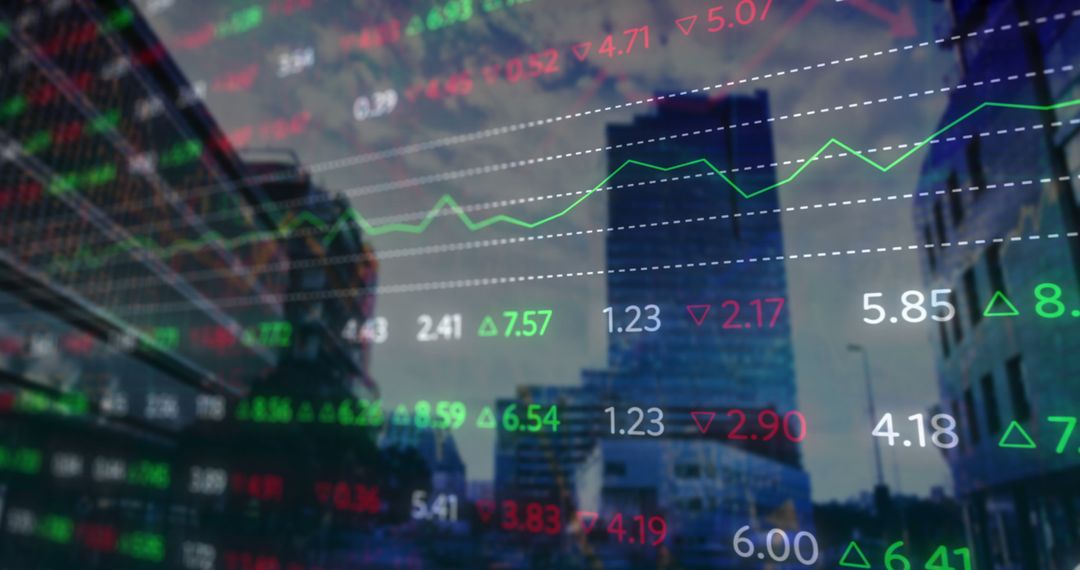
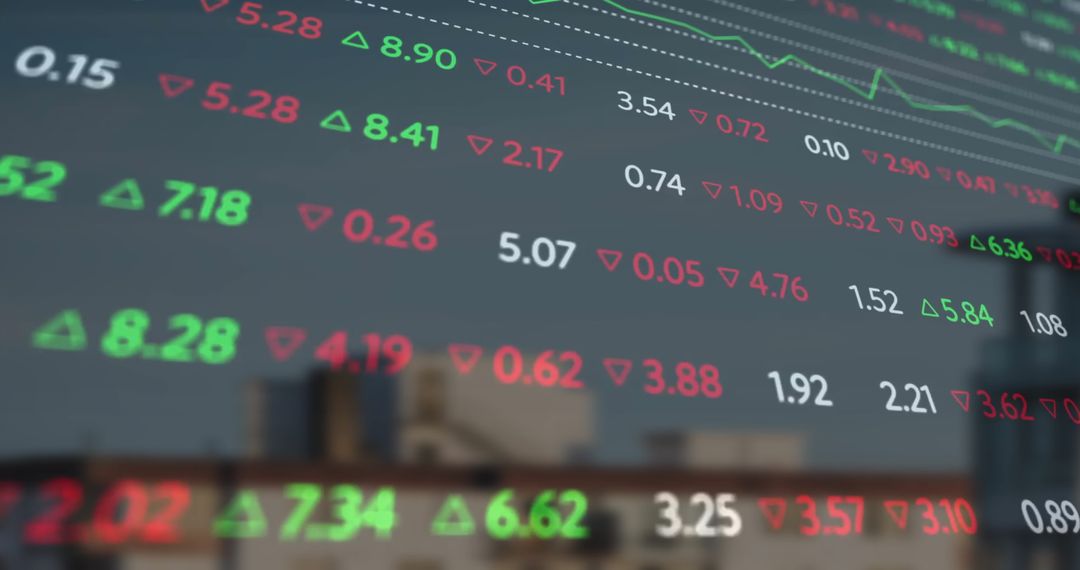
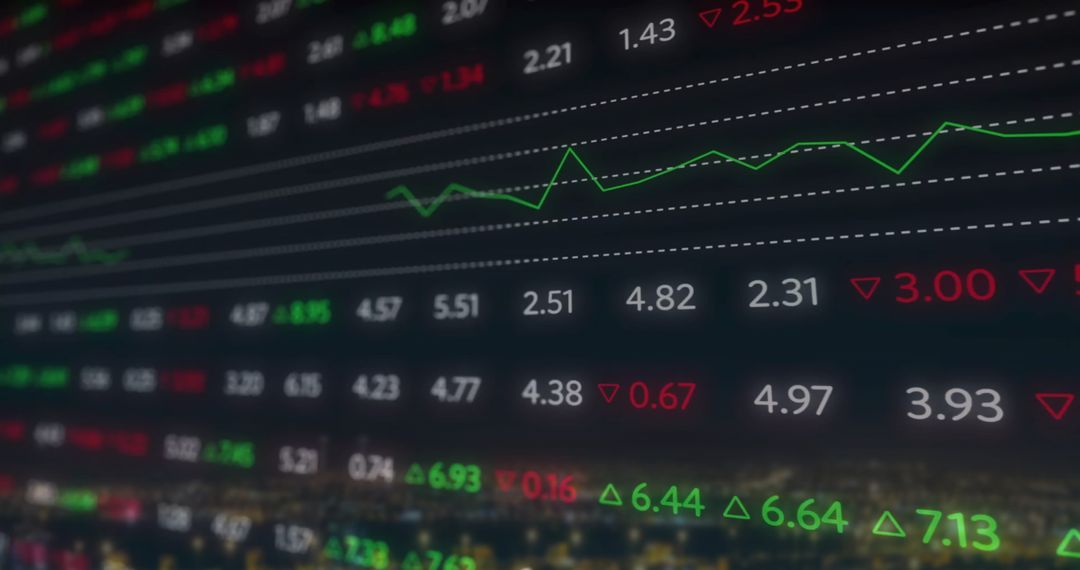
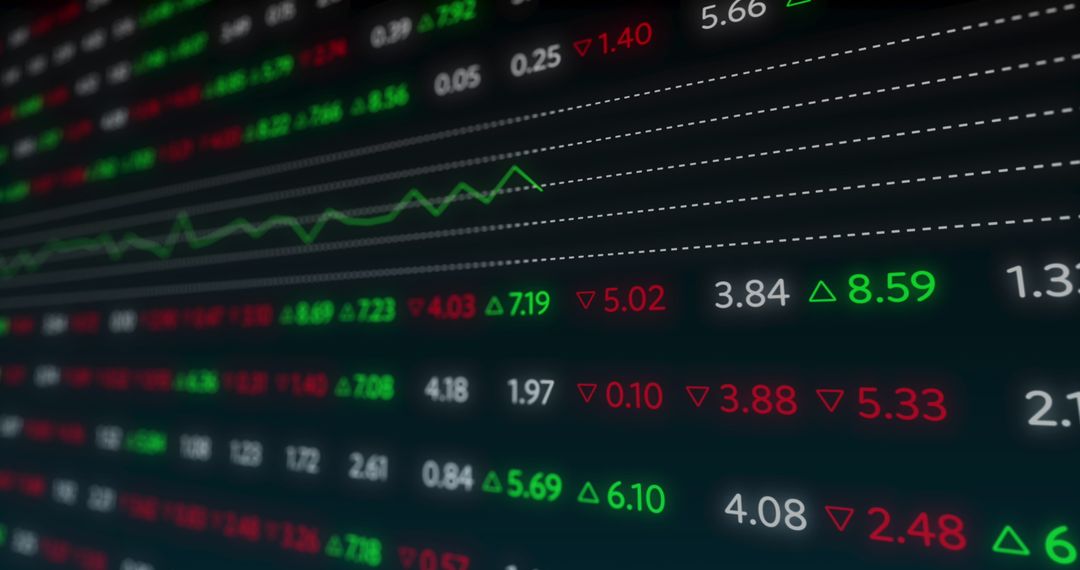
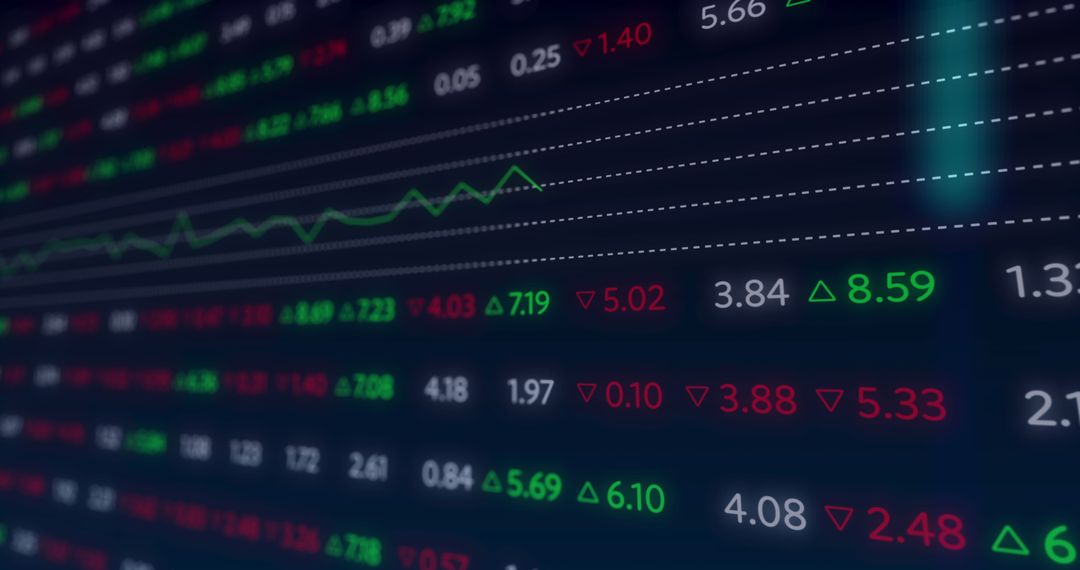
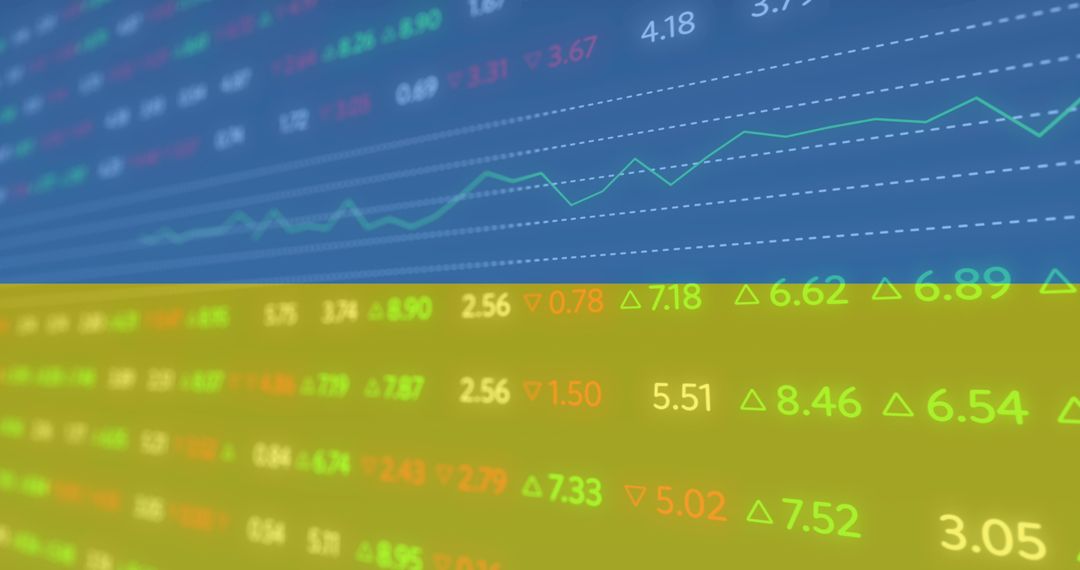
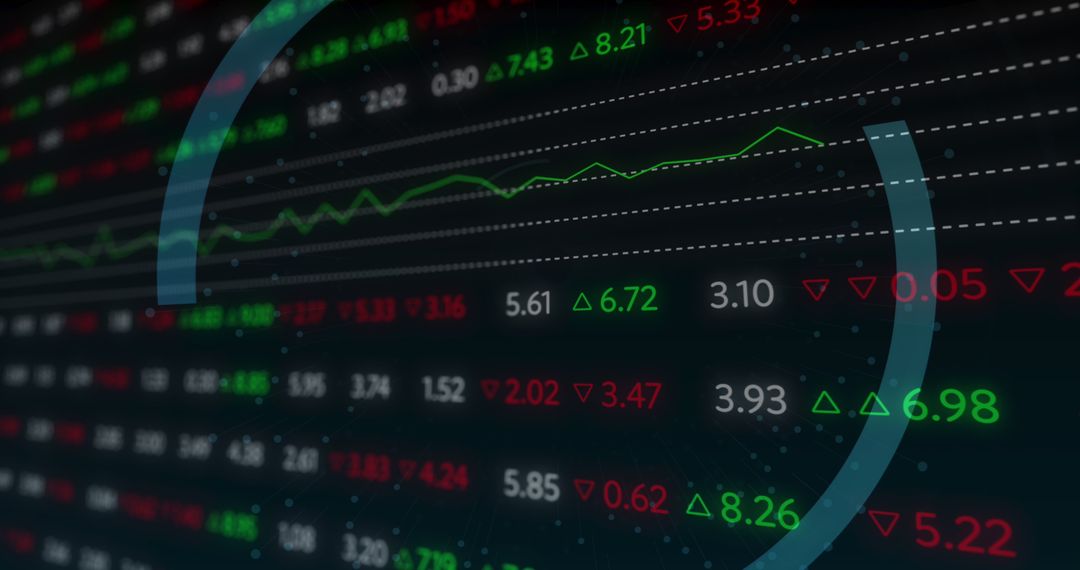
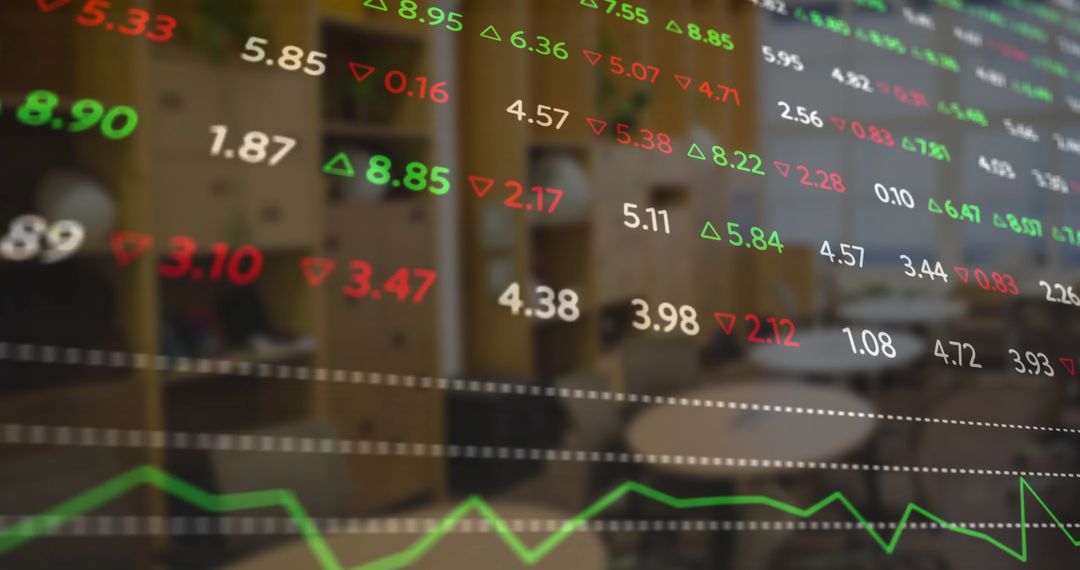
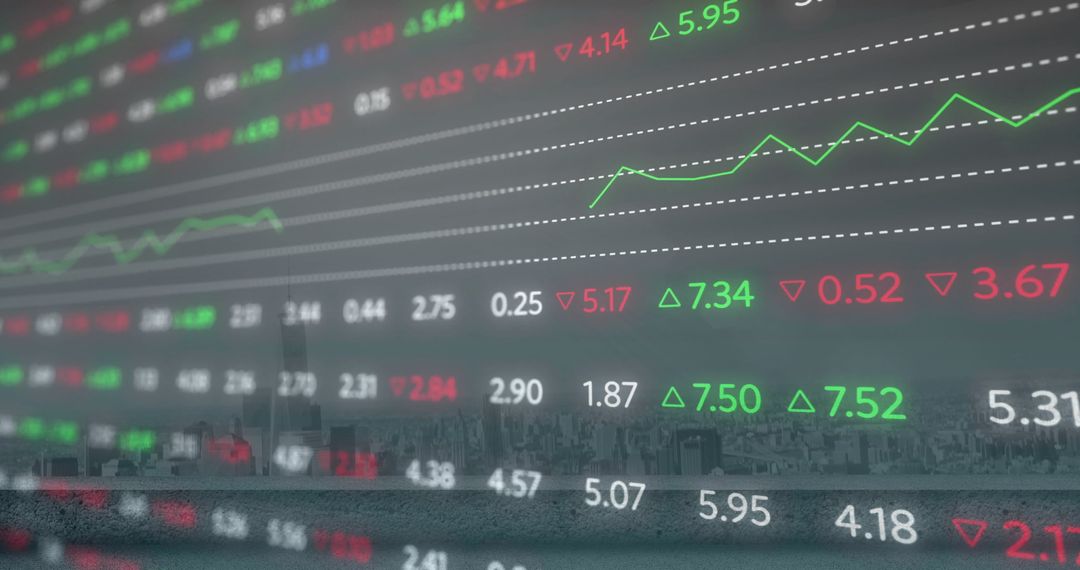
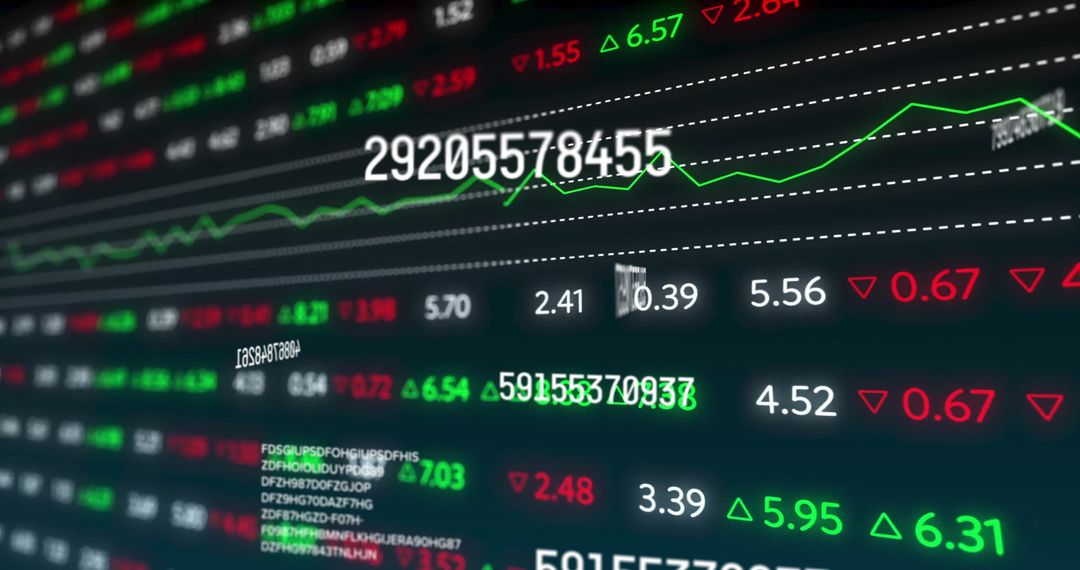
Chart displays with vibrant red and green numbers represent market fluctuations as professional engages with computer for analysis. Ideal for materials related to finance industry insights, economic trends, and business strategies. Useful for articles and presentations on market predictions, business finance technology, or investment tutorials.
Powered by  - Get 15% off with code: PIKWIZARD15


10
downloads
downloads
Tags:
More
Credit Photo
If you would like to credit the Photo, here are some ways you can do so
Text Link
photo Link
<span class="text-link">
<span>
<a target="_blank" href=https://pikwizard.com/photo/stock-market-data-display-with-professional-analyzing/ea1d201f6f822386a6218a78d18ae750/>PikWizard</a>
</span>
</span>
<span class="image-link">
<span
style="margin: 0 0 20px 0; display: inline-block; vertical-align: middle; width: 100%;"
>
<a
target="_blank"
href="https://pikwizard.com/photo/stock-market-data-display-with-professional-analyzing/ea1d201f6f822386a6218a78d18ae750/"
style="text-decoration: none; font-size: 10px; margin: 0;"
>
<img src="https://pikwizard.com/pw/medium/ea1d201f6f822386a6218a78d18ae750.jpg" style="margin: 0; width: 100%;" alt="" />
<p style="font-size: 12px; margin: 0;">PikWizard</p>
</a>
</span>
</span>
Free (free of charge)
Free for personal and commercial use.
Author: Authentic Images
Similar Free Stock Images
Premium


Premium


Premium


Premium


Premium


Premium


Premium


Premium


Premium


Premium


Premium


Premium


Premium


Premium


Premium


Premium


Premium


Premium


Premium


Premium


Premium


Premium


Premium


Premium

