- Home >
- Stock Photos >
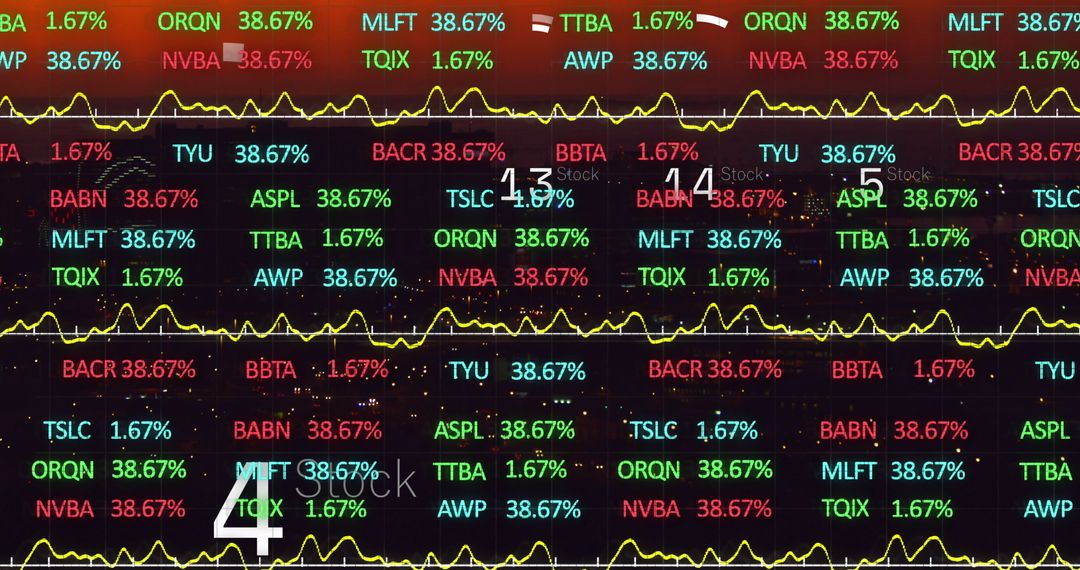
- Stock Market Data Display with Team Analysis in Office Background
Stock Market Data Display with Team Analysis in Office Background Image

Financial data transparently overlayed with colleagues working in background conceptually represents modern business environments. Suitable for illustrating data analytics, financial market insights, and collaborative corporate strategy development in reports or presentations.
Powered by  - Get 15% off with code: PIKWIZARD15


12
downloads
downloads
Tags:
More
Credit Photo
If you would like to credit the Photo, here are some ways you can do so
Text Link
photo Link
<span class="text-link">
<span>
<a target="_blank" href=https://pikwizard.com/photo/stock-market-data-display-with-team-analysis-in-office-background/f80b3096e5173f378a52b322faa9369d/>PikWizard</a>
</span>
</span>
<span class="image-link">
<span
style="margin: 0 0 20px 0; display: inline-block; vertical-align: middle; width: 100%;"
>
<a
target="_blank"
href="https://pikwizard.com/photo/stock-market-data-display-with-team-analysis-in-office-background/f80b3096e5173f378a52b322faa9369d/"
style="text-decoration: none; font-size: 10px; margin: 0;"
>
<img src="https://pikwizard.com/pw/medium/f80b3096e5173f378a52b322faa9369d.jpg" style="margin: 0; width: 100%;" alt="" />
<p style="font-size: 12px; margin: 0;">PikWizard</p>
</a>
</span>
</span>
Free (free of charge)
Free for personal and commercial use.
Author: Creative Art
Similar Free Stock Images

Premium


Premium


Premium


Premium


Premium


Premium


Premium


Premium


Premium


Premium


Premium


Premium


Premium


Premium


Premium


Premium


Premium


Premium


Premium


Premium


Premium


Premium


Premium


Premium